Visualizing Data (in R)
An opinionated style guide
June Choe
2021-02-10
Motivation
Motivation
Why bother improving the quality of your plot?
Motivation
Why bother improving the quality of your plot?
Helps people remember your results better
Motivation
Why bother improving the quality of your plot?
Helps people remember your results better
Makes your findings look more credible
Motivation
Why bother improving the quality of your plot?
Helps people remember your results better
Makes your findings look more credible
Increases the chance of your work being shared
Motivation
Why bother improving the quality of your plot?
Helps people remember your results better
Makes your findings look more credible
Increases the chance of your work being shared
Shows respect for your audience
Motivation
Why bother improving the quality of your plot?
Helps people remember your results better
Makes your findings look more credible
Increases the chance of your work being shared
Shows respect for your audience
Goal of this presentation
Motivation
Why bother improving the quality of your plot?
Helps people remember your results better
Makes your findings look more credible
Increases the chance of your work being shared
Shows respect for your audience
Goal of this presentation
Share practical, language-agnostic tips for improving readability & accessibility
Walk through implementations of these ideas (w/ R code)
Demonstrate that the design just as important as the content
Outline
Outline
Four principles for explanatory data visualization
Outline
Four principles for explanatory data visualization
Make your text readable
Outline
Four principles for explanatory data visualization
Make your text readable
Be generous about margins and spacing
Outline
Four principles for explanatory data visualization
Make your text readable
Be generous about margins and spacing
Make the legend clear but subtle
Outline
Four principles for explanatory data visualization
Make your text readable
Be generous about margins and spacing
Make the legend clear but subtle
Make color easy on your reader's eyes
Outline
Four principles for explanatory data visualization
Make your text readable
Be generous about margins and spacing
Make the legend clear but subtle
Make color easy on your reader's eyes
Showcases/tricks
Minimal designs
Plot composition
Animations
Interactivity
Preliminaries
The {ggplot2} ecosystem in R:
Easy to use and highly customizable
Tons of free resources for learning
Widely used in academia
Lots of extensions

Preliminaries
The {ggplot2} ecosystem in R:
Easy to use and highly customizable
Tons of free resources for learning
Widely used in academia
Lots of extensions
library(extrafont)library(colorspace)library(patchwork)library(ggtext)library(scales)# library(gghighlight)# library(ggforce)# library(ggrepel)# library(gganimate)
# Presidential election results from 1932-2016state_election_votes # A tibble: 1,097 x 3 State demVote Year <chr> <dbl> <dbl> 1 Alabama 0.85 1932 2 Arizona 0.67 1932 3 Arkansas 0.86 1932 4 California 0.580 1932 5 Colorado 0.55 1932 6 Connecticut 0.47 1932 7 Delaware 0.48 1932 8 Florida 0.74 1932 9 Georgia 0.92 1932 10 Idaho 0.59 1932 # ... with 1,087 more rows# Presidential election results from 1932-2016state_election_votes %>% filter(State %in% c("Pennsylvania", "Illinois", "California") ) # A tibble: 66 x 3 State demVote Year <chr> <dbl> <dbl> 1 California 0.580 1932 2 Illinois 0.55 1932 3 Pennsylvania 0.45 1932 4 California 0.67 1936 5 Illinois 0.580 1936 6 Pennsylvania 0.570 1936 7 California 0.570 1940 8 Illinois 0.51 1940 9 Pennsylvania 0.53 1940 10 California 0.56 1944 # ... with 56 more rows# Presidential election results from 1932-2016state_election_votes %>% filter(State %in% c("Pennsylvania", "Illinois", "California") ) %>% ggplot()# Presidential election results from 1932-2016state_election_votes %>% filter(State %in% c("Pennsylvania", "Illinois", "California") ) %>% ggplot() + aes( x = Year, y = demVote, color = State )# Presidential election results from 1932-2016state_election_votes %>% filter(State %in% c("Pennsylvania", "Illinois", "California") ) %>% ggplot() + aes( x = Year, y = demVote, color = State ) + geom_point()# Presidential election results from 1932-2016state_election_votes %>% filter(State %in% c("Pennsylvania", "Illinois", "California") ) %>% ggplot() + aes( x = Year, y = demVote, color = State ) + geom_point() + scale_y_continuous( labels = percent_format(accuracy = 1) )# Presidential election results from 1932-2016state_election_votes %>% filter(State %in% c("Pennsylvania", "Illinois", "California") ) %>% ggplot() + aes( x = Year, y = demVote, color = State ) + geom_point() + scale_y_continuous( labels = percent_format(accuracy = 1) ) + scale_x_continuous( breaks = pretty_breaks(n= 5) )# Presidential election results from 1932-2016state_election_votes %>% filter(State %in% c("Pennsylvania", "Illinois", "California") ) %>% ggplot() + aes( x = Year, y = demVote, color = State ) + geom_point() + scale_y_continuous( labels = percent_format(accuracy = 1) ) + scale_x_continuous( breaks = pretty_breaks(n= 5) ) + labs( y = "Democrat Votes", title = "Go Vote!" )# Presidential election results from 1932-2016state_election_votes %>% filter(State %in% c("Pennsylvania", "Illinois", "California") ) %>% ggplot() + aes( x = Year, y = demVote, color = State ) + geom_point() + scale_y_continuous( labels = percent_format(accuracy = 1) ) + scale_x_continuous( breaks = pretty_breaks(n= 5) ) + labs( y = "Democrat Votes", title = "Go Vote!" )# Presidential election results from 1932-2016state_election_votes %>% filter(State %in% c("Pennsylvania", "Illinois", "California") ) %>% ggplot() + aes( x = Year, y = demVote, color = State ) + geom_point() + scale_y_continuous( labels = percent_format(accuracy = 1) ) + scale_x_continuous( breaks = pretty_breaks(n= 5) ) + labs( y = "Democrat Votes", title = "Go Vote!" )# Presidential election results from 1932-2016state_election_votes %>% filter(State %in% c("Pennsylvania", "Illinois", "California") ) %>% ggplot() + aes( x = Year, y = demVote, color = State ) + geom_line() + scale_y_continuous( labels = percent_format(accuracy = 1) ) + scale_x_continuous( breaks = pretty_breaks(n= 5) ) + labs( y = "Democrat Votes", title = "Go Vote!" )# Presidential election results from 1932-2016state_election_votes %>% filter(State %in% c("Pennsylvania", "Illinois", "California") ) %>% ggplot() + aes( x = Year, y = demVote, color = State ) + geom_line(size = 1) + scale_y_continuous( labels = percent_format(accuracy = 1) ) + scale_x_continuous( breaks = pretty_breaks(n= 5) ) + labs( y = "Democrat Votes", title = "Go Vote!" )Yay a plot!
Yay a plot... ?
Areas of improvement
Text is small and narrow
Plot elements are squished together
Difficult to focus on individual colors
Legend is off to the side on its own
1. Text
1. Text
Many different ways to style text:
1. Text
Many different ways to style text:
font size
1. Text
Many different ways to style text:
font size
Font face (bold, italic, small caps)
1. Text
Many different ways to style text:
font size
Font face (bold, italic, small caps)
Font family ( Times New Roman, Calibri, Arial, Hi friends )
1. Text
Many different ways to style text:
font size
Font face (bold, italic, small caps)
Font family ( Times New Roman, Calibri, Arial, Hi friends )
Font color, letter spacing, angle, weight, etc.
1. Text
Many different ways to style text:
font size
Font face (bold, italic, small caps)
Font family ( Times New Roman, Calibri, Arial, Hi friends )
Font color, letter spacing, angle, weight, etc.
Often times you'll likely only have access to a limited set:
1. Text
Many different ways to style text:
font size
Font face (bold, italic, small caps)
Font family ( Times New Roman, Calibri, Arial, Hi friends )
Font color, letter spacing, angle, weight, etc.
Often times you'll likely only have access to a limited set:
Font size, font family, and limited set of font styles
But you can get pretty far with these!
state_election_plotstate_election_plot + theme(text = element_text(size = 15))state_election_plot + theme(text = element_text(size = 15)) + theme(plot.title = element_text(size = 20))state_election_plot + theme(text = element_text(size = 15)) + theme(plot.title = element_text(size = 20)) + theme(text = element_text(family = "Open Sans"))state_election_plot + theme(text = element_text(size = 15)) + theme(plot.title = element_text(size = 20)) + theme(text = element_text(family = "Open Sans")) + theme(plot.title = element_text(family = "Roboto Slab"))state_election_plot + theme(text = element_text(size = 15)) + theme(plot.title = element_text(size = 20)) + theme(text = element_text(family = "Open Sans")) + theme(plot.title = element_text(family = "Roboto Slab")) + theme(plot.title.position = "plot")state_election_plot + theme(text = element_text(size = 15)) + theme(plot.title = element_text(size = 20)) + theme(text = element_text(family = "Open Sans")) + theme(plot.title = element_text(family = "Roboto Slab")) + theme(plot.title.position = "plot") + labs(x = "Election Year")state_election_plot + theme(text = element_text(size = 15)) + theme(plot.title = element_text(size = 20)) + theme(text = element_text(family = "Open Sans")) + theme(plot.title = element_text(family = "Roboto Slab")) + theme(plot.title.position = "plot") + labs(x = "Election Year") + labs(y = NULL)state_election_plot + theme(text = element_text(size = 15)) + theme(plot.title = element_text(size = 20)) + theme(text = element_text(family = "Open Sans")) + theme(plot.title = element_text(family = "Roboto Slab")) + theme(plot.title.position = "plot") + labs(x = "Election Year") + labs(y = NULL) + labs(title = "Percent of democrat votes by state")state_election_plot + theme(text = element_text(size = 15)) + theme(plot.title = element_text(size = 20)) + theme(text = element_text(family = "Open Sans")) + theme(plot.title = element_text(family = "Roboto Slab")) + theme(plot.title.position = "plot") + labs(x = "Election Year") + labs(y = NULL) + labs(title = "Percent of democrat votes by state") + labs(subtitle = "We're a swing state! Go vote!")state_election_plot + theme(text = element_text(size = 15)) + theme(plot.title = element_text(size = 20)) + theme(text = element_text(family = "Open Sans")) + theme(plot.title = element_text(family = "Roboto Slab")) + theme(plot.title.position = "plot") + labs(x = "Election Year") + labs(y = NULL) + labs(title = "Percent of democrat votes by state") + labs(subtitle = "We're a swing state! Go vote!") + theme(plot.subtitle = element_text(face = "italic"))state_election_plot + theme(text = element_text(size = 15)) + theme(plot.title = element_text(size = 20)) + theme(text = element_text(family = "Adelle")) + theme(plot.title = element_text(family = "Roboto Slab")) + theme(plot.title.position = "plot") + labs(x = "Election Year") + labs(y = NULL) + labs(title = "Percent of democrat votes by state") + labs(subtitle = "We're a swing state! Go vote!") + theme(plot.subtitle = element_text(face = "italic"))state_election_plot + theme(text = element_text(size = 15)) + theme(plot.title = element_text(size = 20)) + theme(text = element_text(family = "Bitter")) + theme(plot.title = element_text(family = "Roboto Slab")) + theme(plot.title.position = "plot") + labs(x = "Election Year") + labs(y = NULL) + labs(title = "Percent of democrat votes by state") + labs(subtitle = "We're a swing state! Go vote!") + theme(plot.subtitle = element_text(face = "italic"))state_election_plot + theme(text = element_text(size = 15)) + theme(plot.title = element_text(size = 20)) + theme(text = element_text(family = "Montserrat")) + theme(plot.title = element_text(family = "Roboto Slab")) + theme(plot.title.position = "plot") + labs(x = "Election Year") + labs(y = NULL) + labs(title = "Percent of democrat votes by state") + labs(subtitle = "We're a swing state! Go vote!") + theme(plot.subtitle = element_text(face = "italic"))state_election_plot + theme(text = element_text(size = 15)) + theme(plot.title = element_text(size = 20)) + theme(text = element_text(family = "Montserrat Medium")) + theme(plot.title = element_text(family = "Roboto Slab")) + theme(plot.title.position = "plot") + labs(x = "Election Year") + labs(y = NULL) + labs(title = "Percent of democrat votes by state") + labs(subtitle = "We're a swing state! Go vote!") + theme(plot.subtitle = element_text(face = "italic"))state_election_plot + theme(text = element_text(size = 15)) + theme(plot.title = element_text(size = 20)) + theme(text = element_text(family = "xkcd")) + theme(plot.title = element_text(family = "Roboto Slab")) + theme(plot.title.position = "plot") + labs(x = "Election Year") + labs(y = NULL) + labs(title = "Percent of democrat votes by state") + labs(subtitle = "We're a swing state! Go vote!") + theme(plot.subtitle = element_text(face = "italic"))1. Text (End!)
state_election_plot + theme( text = element_text(size = 15, family = "Open Sans"), plot.title = element_text(size = 20, family = "Roboto Slab"), plot.title.position = "plot", plot.subtitle = element_text(face = "italic"), axis.text = element_text(size = 14) ) + labs( x = "Election Year", y = NULL, title = "Percent of democrat votes by state", subtitle = "We're a swing state! Go vote!" )Save our progress!
state_election_plot_A1. Text (Before-After)
2. Margin & Spacing
2. Margins & Spacing
2. Margins & Spacing
2. Margins & Spacing
2. Margins & Spacing
Margin and spacing considerations:
2. Margins & Spacing
Margin and spacing considerations:
Margins around plot make it easier to embed figures
2. Margins & Spacing
Margin and spacing considerations:
Margins around plot make it easier to embed figures
Spacing between text elements improves readability
2. Margins & Spacing
Margin and spacing considerations:
Margins around plot make it easier to embed figures
Spacing between text elements improves readability
Disproportionate white (empty) space can be distracting
2. Margins & Spacing
Margin and spacing considerations:
Margins around plot make it easier to embed figures
Spacing between text elements improves readability
Disproportionate white (empty) space can be distracting
Padding inside the panel is essential for a sense of "completeness"
2. Margins & Spacing
Margin and spacing considerations:
Margins around plot make it easier to embed figures
Spacing between text elements improves readability
Disproportionate white (empty) space can be distracting
Padding inside the panel is essential for a sense of "completeness"
Know your margin/spacing elements in {ggplot2}!
margin(t = 0, r = 0, b = 0, l = 0, unit = c("pt", "mm", "cm", "in"))hjust,vjust, andlineheightarguments inelement_text()expandargument withexpansion()inscale_*()andcoord_*()layers
state_election_plot_Astate_election_plot_A + theme( plot.background = element_rect(color = 'black') )state_election_plot_A + theme( plot.background = element_rect(color = 'black') ) + theme( plot.margin = margin(1, .8, .8, .8, "cm") )state_election_plot_A + theme( plot.background = element_rect(color = 'black') ) + theme( plot.margin = margin(1, .8, .8, .8, "cm") ) + theme( plot.title = element_text(margin = margin(b = .3, unit = "cm")) )state_election_plot_A + theme( plot.background = element_rect(color = 'black') ) + theme( plot.margin = margin(1, .8, .8, .8, "cm") ) + theme( plot.title = element_text(margin = margin(b = .3, unit = "cm")) ) + theme( plot.subtitle = element_text(margin = margin(b = .3, unit = "cm")) )state_election_plot_A + theme( plot.background = element_rect(color = 'black') ) + theme( plot.margin = margin(1, .8, .8, .8, "cm") ) + theme( plot.title = element_text(margin = margin(b = .3, unit = "cm")) ) + theme( plot.subtitle = element_text(margin = margin(b = .3, unit = "cm")) ) + theme( axis.text.x = element_text(margin = margin(t = .2, unit = "cm")) )state_election_plot_A + theme( plot.background = element_rect(color = 'black') ) + theme( plot.margin = margin(1, .8, .8, .8, "cm") ) + theme( plot.title = element_text(margin = margin(b = .3, unit = "cm")) ) + theme( plot.subtitle = element_text(margin = margin(b = .3, unit = "cm")) ) + theme( axis.text.x = element_text(margin = margin(t = .2, unit = "cm")) ) + theme( axis.text.y = element_text(margin = margin(r = .1, unit = "cm")) )state_election_plot_A + theme( plot.background = element_rect(color = 'black') ) + theme( plot.margin = margin(1, .8, .8, .8, "cm") ) + theme( plot.title = element_text(margin = margin(b = .3, unit = "cm")) ) + theme( plot.subtitle = element_text(margin = margin(b = .3, unit = "cm")) ) + theme( axis.text.x = element_text(margin = margin(t = .2, unit = "cm")) ) + theme( axis.text.y = element_text(margin = margin(r = .1, unit = "cm")) ) + theme( axis.title.x = element_text(margin = margin(t = .3, unit = "cm")) )state_election_plot_A + theme( plot.background = element_rect(color = 'black') ) + theme( plot.margin = margin(1, .8, .8, .8, "cm") ) + theme( plot.title = element_text(margin = margin(b = .3, unit = "cm")) ) + theme( plot.subtitle = element_text(margin = margin(b = .3, unit = "cm")) ) + theme( axis.text.x = element_text(margin = margin(t = .2, unit = "cm")) ) + theme( axis.text.y = element_text(margin = margin(r = .1, unit = "cm")) ) + theme( axis.title.x = element_text(margin = margin(t = .3, unit = "cm")) ) + coord_cartesian(expand = FALSE)state_election_plot_A + theme( plot.background = element_rect(color = 'black') ) + theme( plot.margin = margin(1, .8, .8, .8, "cm") ) + theme( plot.title = element_text(margin = margin(b = .3, unit = "cm")) ) + theme( plot.subtitle = element_text(margin = margin(b = .3, unit = "cm")) ) + theme( axis.text.x = element_text(margin = margin(t = .2, unit = "cm")) ) + theme( axis.text.y = element_text(margin = margin(r = .1, unit = "cm")) ) + theme( axis.title.x = element_text(margin = margin(t = .3, unit = "cm")) ) + scale_x_continuous(expand = expansion(add = 3))state_election_plot_A + theme( plot.background = element_rect(color = 'black') ) + theme( plot.margin = margin(1, .8, .8, .8, "cm") ) + theme( plot.title = element_text(margin = margin(b = .3, unit = "cm")) ) + theme( plot.subtitle = element_text(margin = margin(b = .3, unit = "cm")) ) + theme( axis.text.x = element_text(margin = margin(t = .2, unit = "cm")) ) + theme( axis.text.y = element_text(margin = margin(r = .1, unit = "cm")) ) + theme( axis.title.x = element_text(margin = margin(t = .3, unit = "cm")) ) + scale_x_continuous(expand = expansion(add = c(2, 3)))state_election_plot_A + theme( plot.background = element_rect(color = 'black') ) + theme( plot.margin = margin(1, .8, .8, .8, "cm") ) + theme( plot.title = element_text(margin = margin(b = .3, unit = "cm")) ) + theme( plot.subtitle = element_text(margin = margin(b = .3, unit = "cm")) ) + theme( axis.text.x = element_text(margin = margin(t = .2, unit = "cm")) ) + theme( axis.text.y = element_text(margin = margin(r = .1, unit = "cm")) ) + theme( axis.title.x = element_text(margin = margin(t = .3, unit = "cm")) ) + scale_x_continuous(expand = expansion(add = c(2, 3)), breaks = pretty_breaks(5))2. Margins & Spacing (End!)
state_election_plot_A + theme( plot.margin = margin(1, .8, .8, .8, "cm"), plot.title = element_text(margin = margin(b = .3, unit = "cm")), plot.subtitle = element_text(margin = margin(b = .3, unit = "cm")), axis.text.x = element_text(margin = margin(t = .2, unit = "cm")), axis.text.y = element_text(margin = margin(r = .1, unit = "cm")), axis.title.x = element_text(margin = margin(t = .3, unit = "cm")) ) + scale_x_continuous( expand = expansion(add = c(2, 3)), breaks = pretty_breaks(5) )Save our progress!
state_election_plot_B2. Margins & Spacing (Before-After)
2. Margins & Spacing (Before-After)
3. Legends
3. Legends
3. Legends
Legends are really hard:
3. Legends
Legends are really hard:
They contain important info, but difficult to make them not look out of place
3. Legends
Legends are really hard:
They contain important info, but difficult to make them not look out of place
It's better not to have a legend, if you can get away with it
3. Legends
Legends are really hard:
They contain important info, but difficult to make them not look out of place
It's better not to have a legend, if you can get away with it
But sometimes we don't have the luxury of doing so
3. Legends
Legends are really hard:
They contain important info, but difficult to make them not look out of place
It's better not to have a legend, if you can get away with it
But sometimes we don't have the luxury of doing so
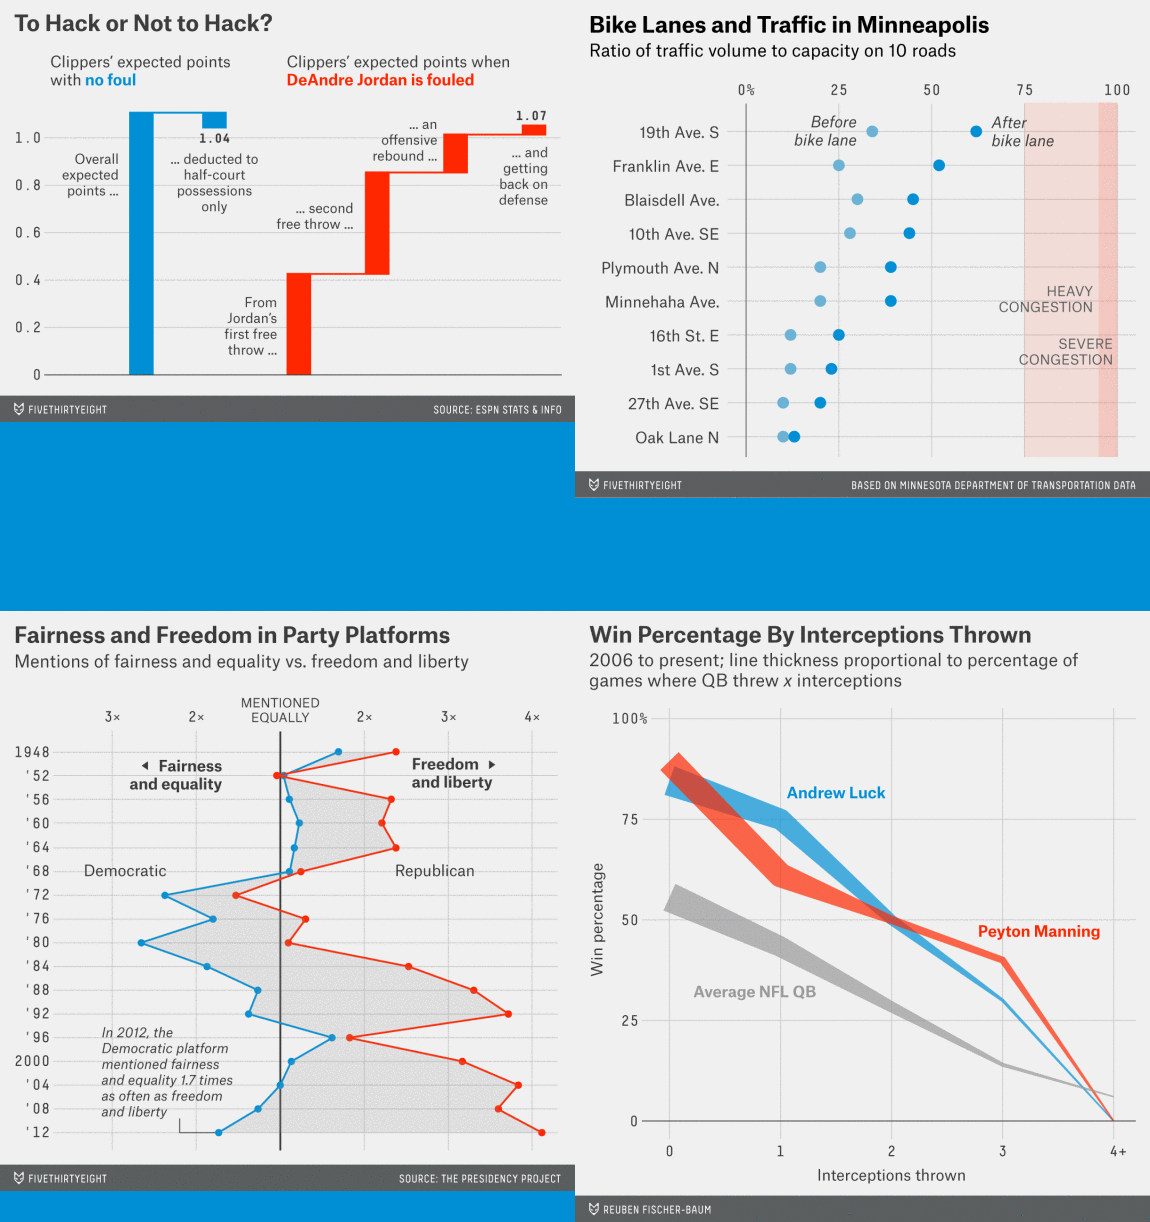
Alternative: consider labeling the data directly
3. Legends
Legends are really hard:
They contain important info, but difficult to make them not look out of place
It's better not to have a legend, if you can get away with it
But sometimes we don't have the luxury of doing so
Alternative: consider labeling the data directly
3. Legends
Legends are really hard:
They contain important info, but difficult to make them not look out of place
It's better not to have a legend, if you can get away with it
But sometimes we don't have the luxury of doing so
Alternative: consider labeling the data directly
But if you must have a legend, make it so that the reader is naturally guided to it
Positioned at the top-left or top-center of the plot
Blends smoothly into the rest of the plot (NOT make them stand out!)
state_election_plot_Bstate_election_plot_B + theme( legend.key = element_rect(color = NA, fill = NA), )state_election_plot_B + theme( legend.key = element_rect(color = NA, fill = NA), ) + theme( legend.position = c(.45, .93) )state_election_plot_B + theme( legend.key = element_rect(color = NA, fill = NA), ) + theme( legend.position = c(.45, .93) ) + theme( legend.direction = "horizontal" )state_election_plot_B + theme( legend.key = element_rect(color = NA, fill = NA), ) + theme( legend.position = c(.45, .93) ) + theme( legend.direction = "horizontal" ) + theme( legend.background = element_rect(fill = "grey92") )state_election_plot_B + theme( legend.key = element_rect(color = NA, fill = NA), ) + theme( legend.position = c(.45, .93) ) + theme( legend.direction = "horizontal" ) + theme( legend.background = element_rect(fill = "grey92") ) + scale_y_continuous( expand = expansion(add = c(0.02, .05)), labels = percent_format(accuracy = 1) )state_election_plot_B + theme( legend.key = element_rect(color = NA, fill = NA), ) + theme( legend.position = c(.45, .93) ) + theme( legend.direction = "horizontal" ) + theme( legend.background = element_rect(fill = "grey92") ) + scale_y_continuous( expand = expansion(add = c(0.02, .05)), labels = percent_format(accuracy = 1) ) + labs(color = NULL)3. Legends (End!)
state_election_plot_B + theme( legend.key = element_rect(fill = NA), legend.position = c(.45, .93), legend.direction = "horizontal", legend.background = element_rect(fill = "grey92") ) + scale_y_continuous( expand = expansion(add = c(0.02, .05)), labels = percent_format(accuracy = 1) ) + labs(color = NULL)Save our progress!
state_election_plot_C3. Legends (Before-After)
4. Color
4. Color
4. Color
Colors are a double-edged sword
4. Color
Colors are a double-edged sword
Perception can vary widely depending on reader, medium, culture, etc.
chroma::show_col(rainbow(6))specplot(rainbow(6))HSV
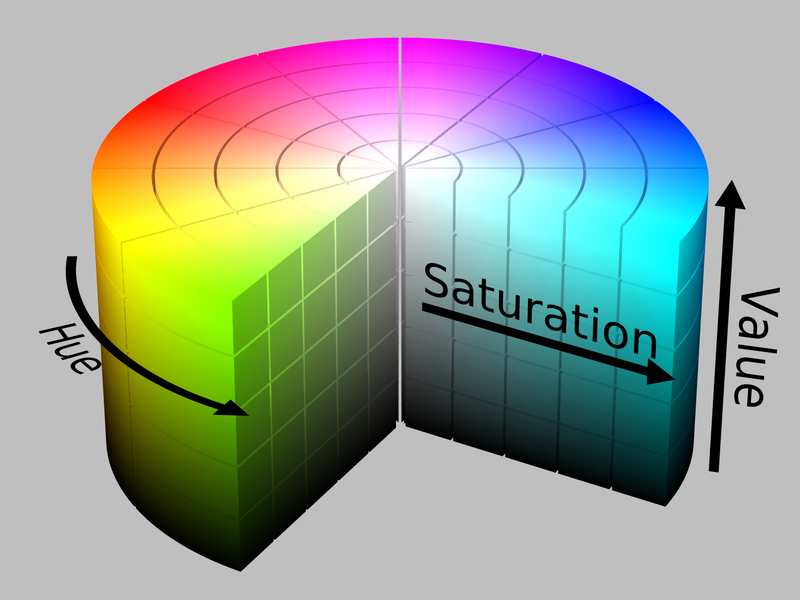
HSV

HCL
4. Color
Colors are a double-edged sword
- Perception can vary widely depending on reader, medium, culture, etc.
If you must use colors, DO:
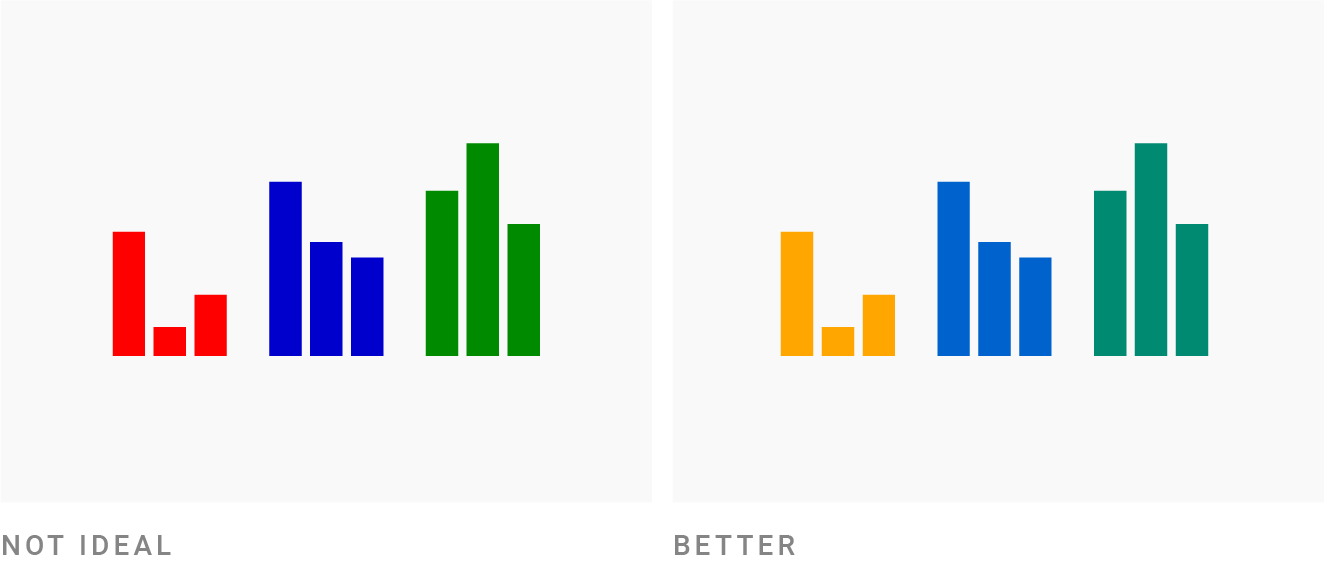
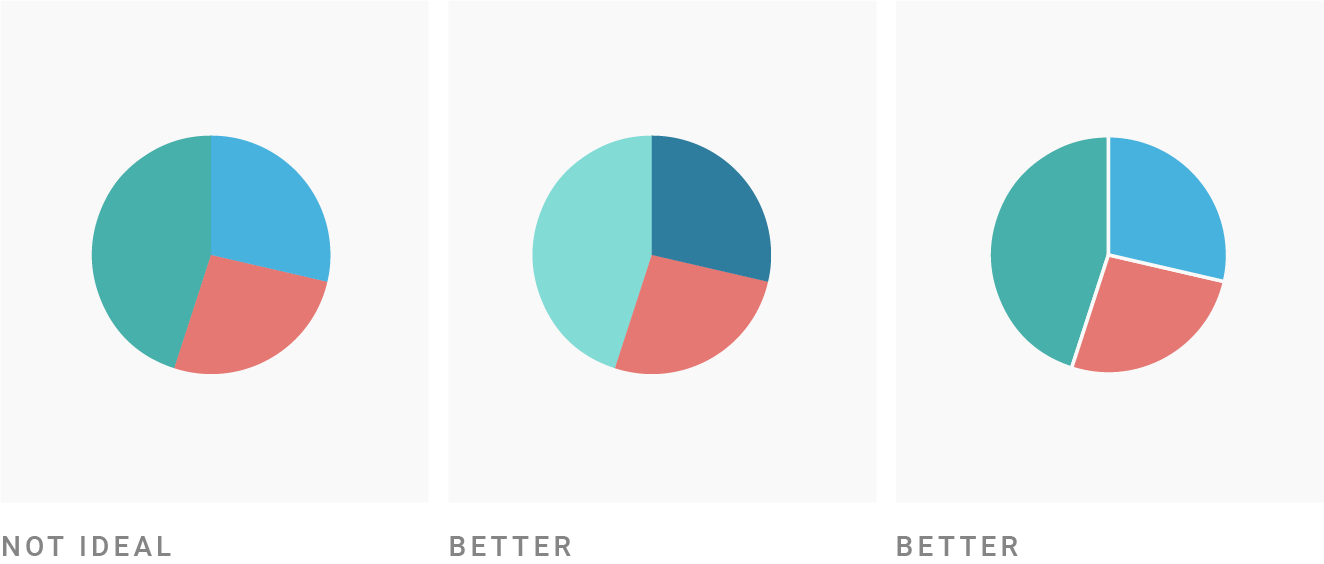
Avoid pure colors (no random sampling from the rainbow!)
Contrast colors in more than one dimension
Correlation matrix example
corr_left <- ggcorrplot::ggcorrplot(cor(mtcars)) + scale_fill_gradient2(low = "blue", mid = "white", high = "red", limits = c(-1, 1), guide = guide_colorbar(title = NULL, barheight = unit(15, 'lines')))corr_right <- ggcorrplot::ggcorrplot(cor(mtcars)) + scale_fill_continuous_diverging(palette = "Blue-Red 3", limits = c(-1, 1), guide = guide_colorbar(title = NULL, barheight = unit(15, 'lines')))patchwork::wrap_plots(corr_left, corr_right, nrow = 1)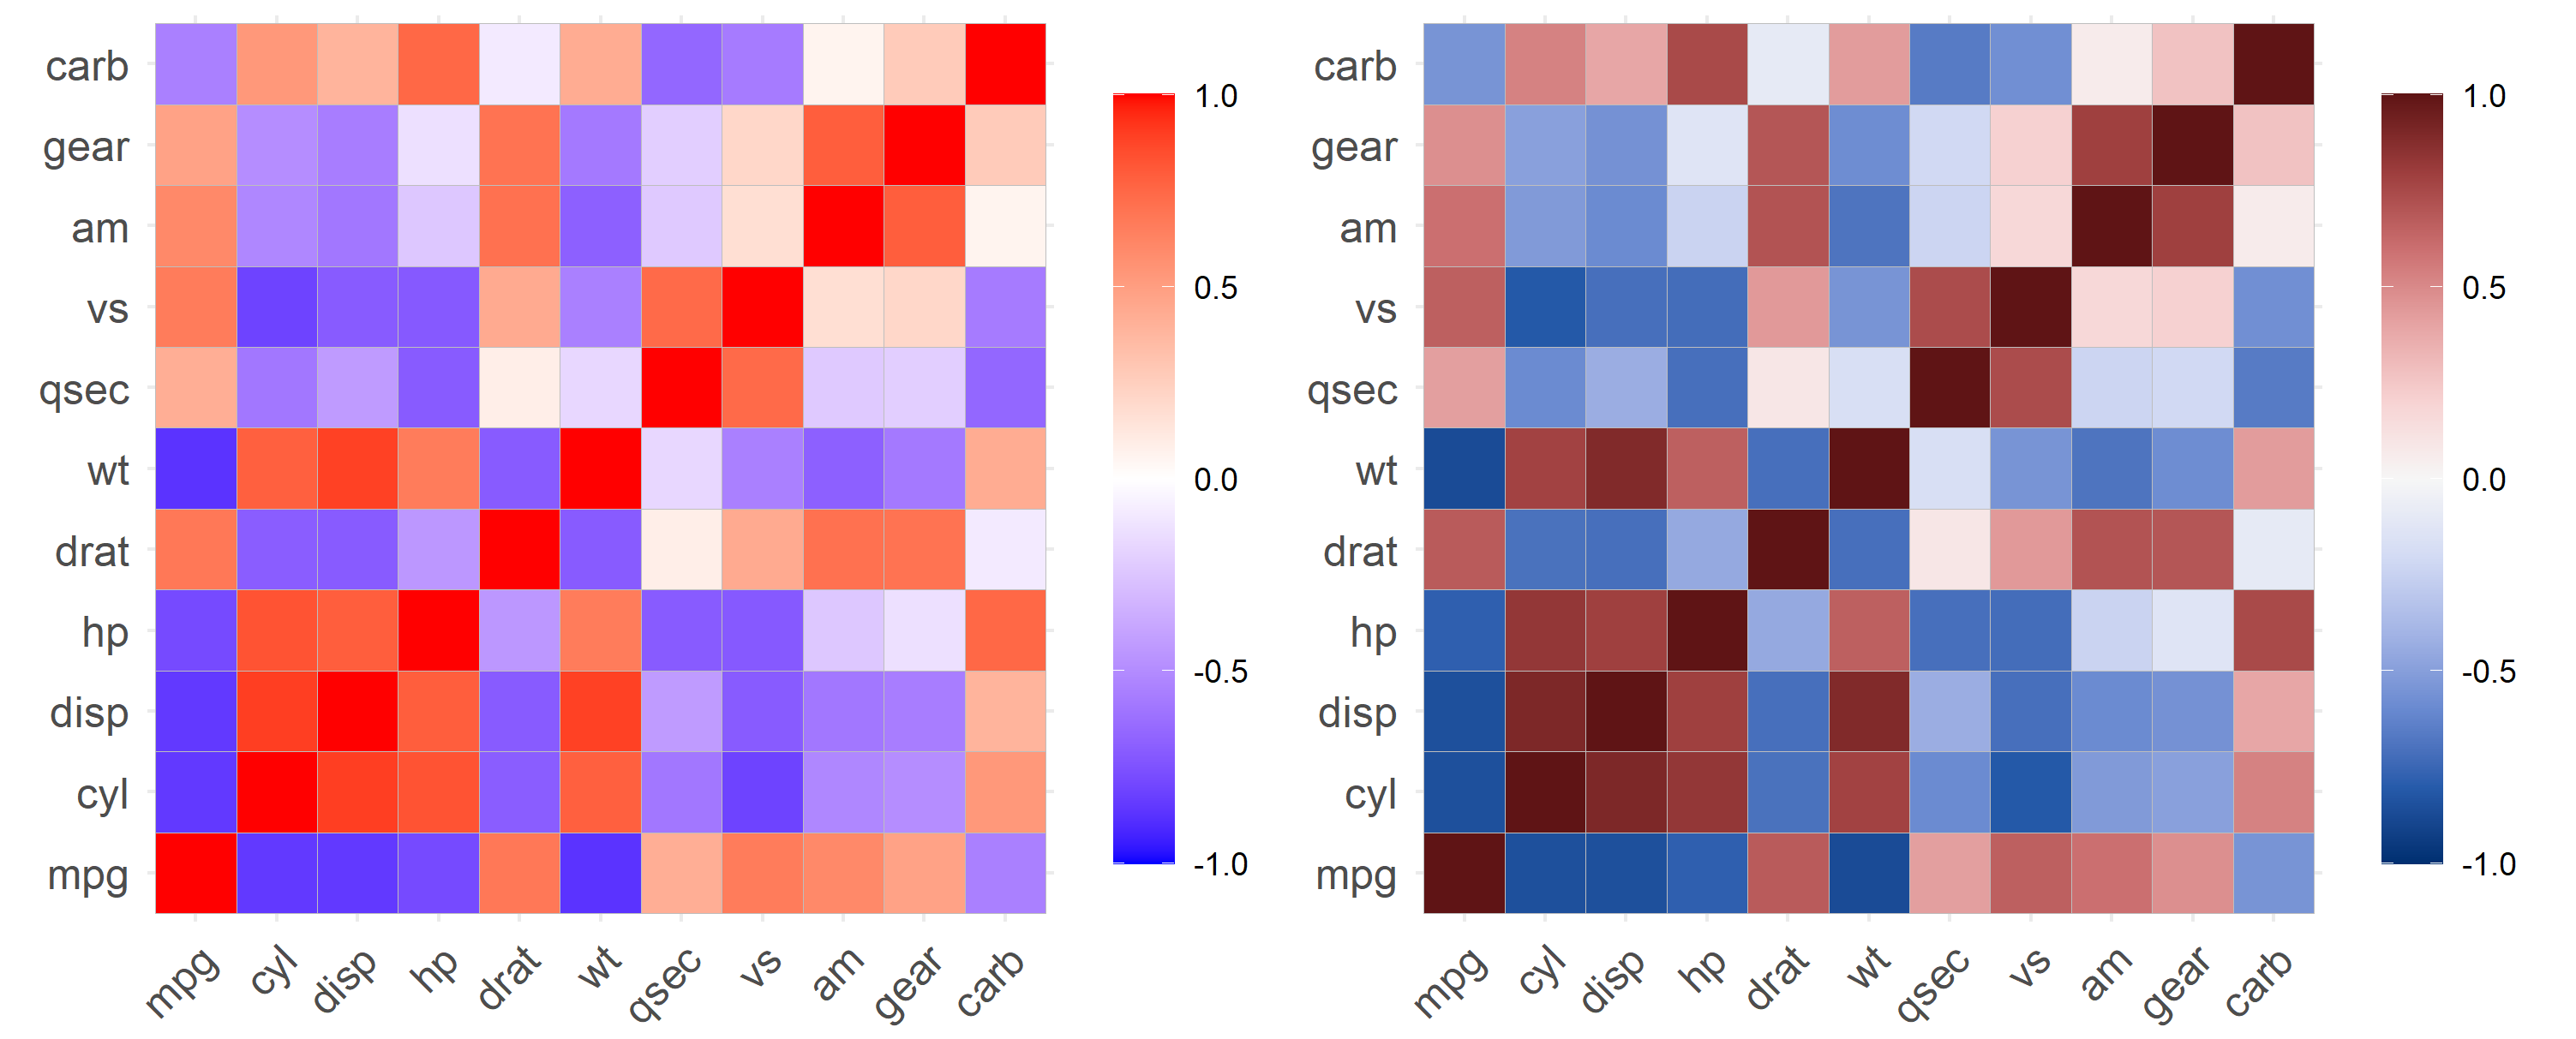
Correlation matrix example
corr_desaturated_left <- cowplot::ggdraw(colorblindr::edit_colors(corr_left, desaturate))corr_desaturated_right <- cowplot::ggdraw(colorblindr::edit_colors(corr_right, desaturate))patchwork::wrap_plots(corr_desaturated_left, corr_desaturated_right, nrow = 1)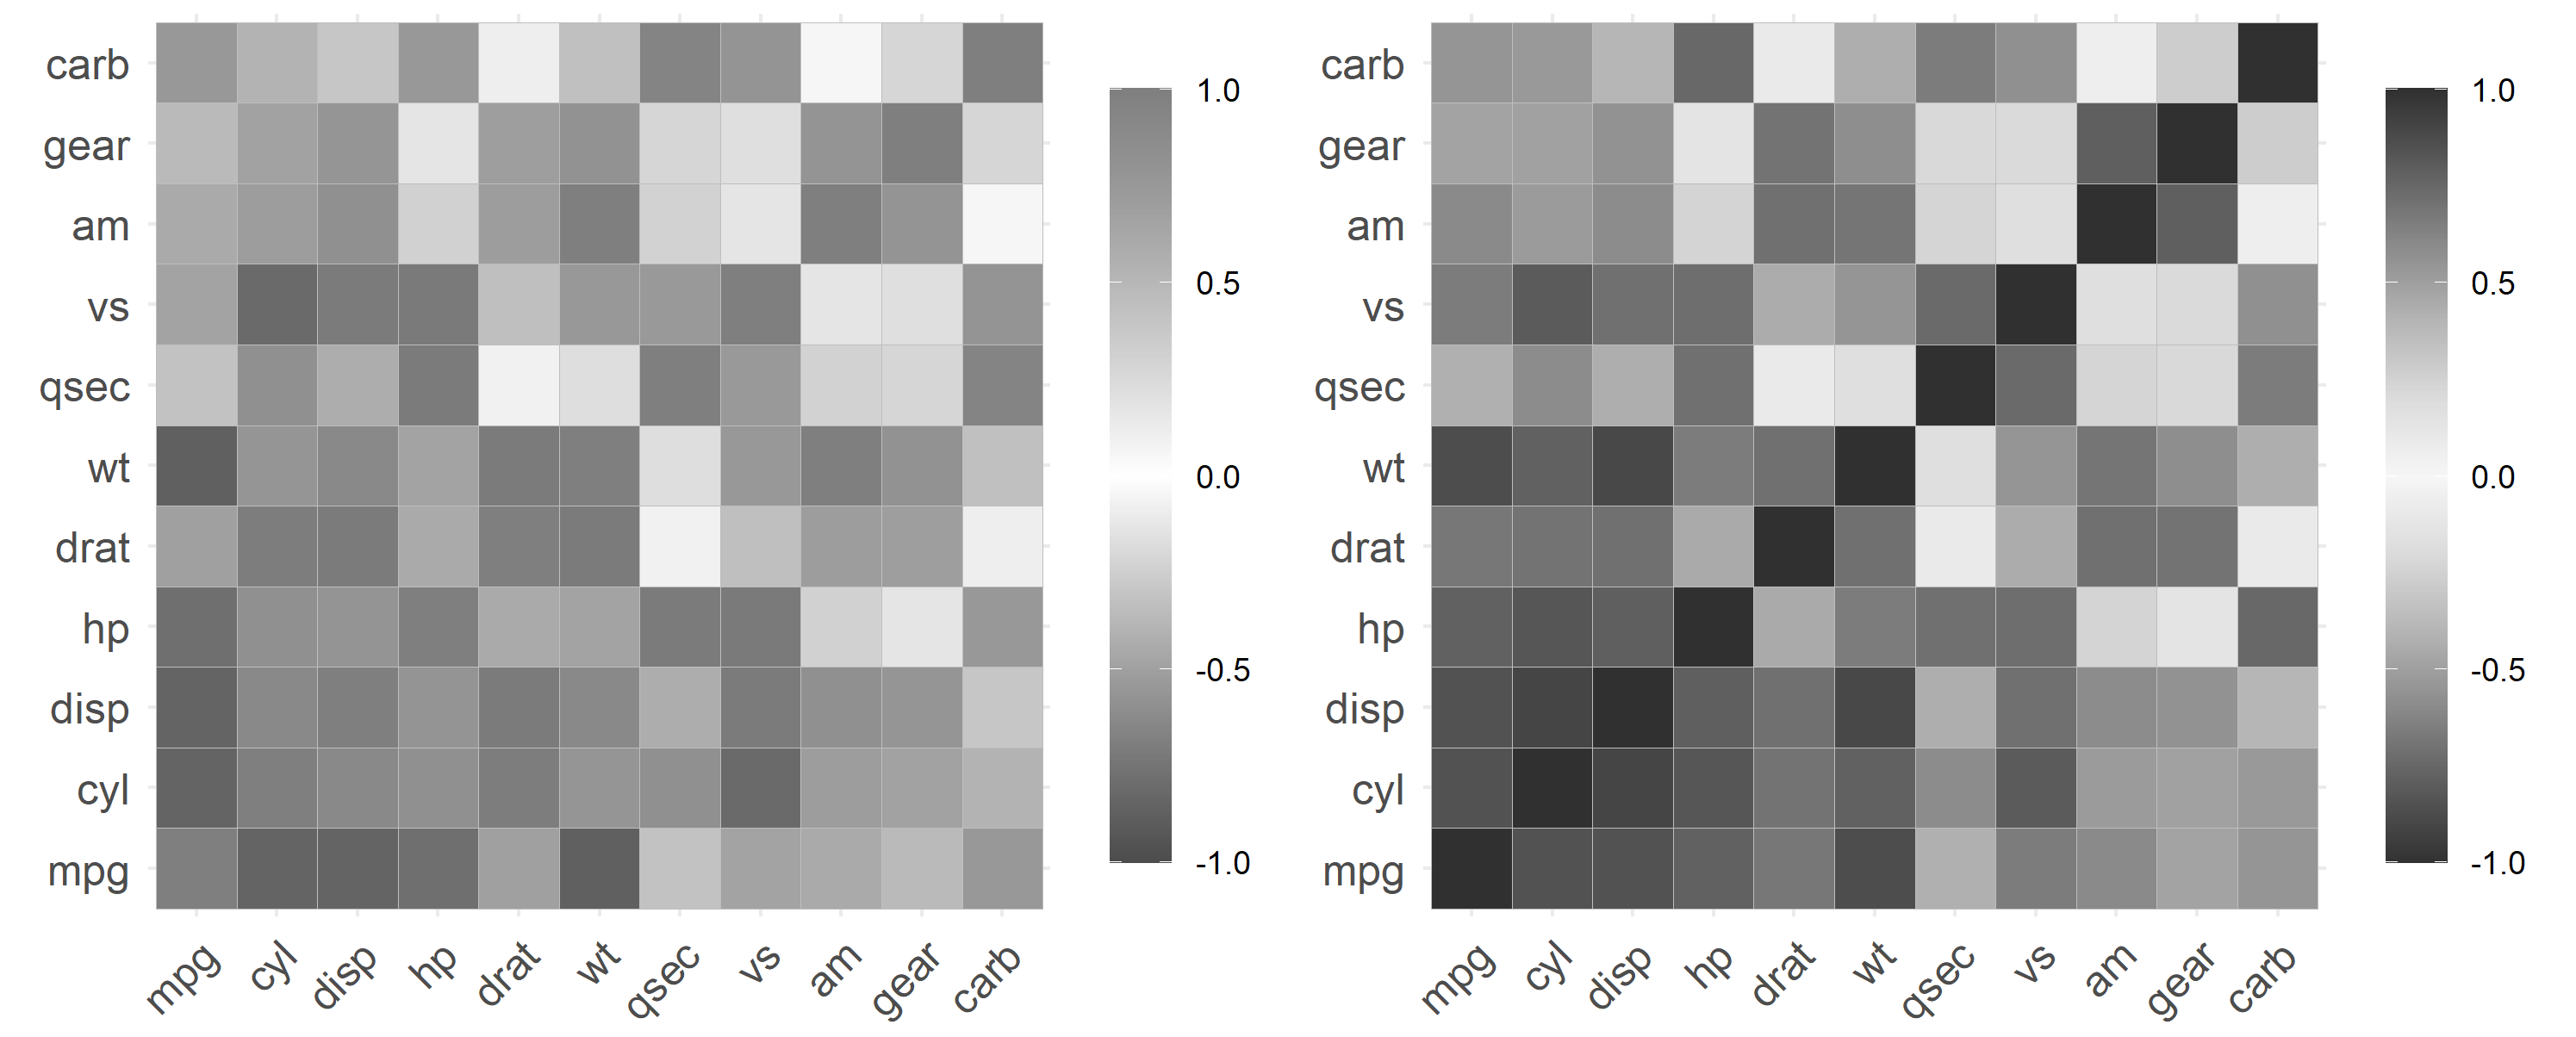
Correlation matrix example
palette_left <- scales::div_gradient_pal(low = "blue", mid = "white", high = "red")(seq(0, 1, length.out = 7))palette_right <- colorspace::diverge_hcl(7, palette = "Blue-Red 3")4. Color
Colors are a double-edged sword
- Perception can vary widely depending on reader, medium, culture, etc.
If you must, DO:
- Avoid pure colors (no random sampling from the rainbow!)
- Contrast colors in more than one dimension
If you aren't sure, use pre-made palettes or play around with online color tools
state_election_plot_Cstate_election_plot_C + theme(panel.background = element_rect(fill = NA))state_election_plot_C + theme(panel.background = element_rect(fill = NA)) + theme(legend.background = element_rect(fill = NA))state_election_plot_C + theme(panel.background = element_rect(fill = NA)) + theme(legend.background = element_rect(fill = NA)) + theme(axis.line = element_line())state_election_plot_C + theme(panel.background = element_rect(fill = NA)) + theme(legend.background = element_rect(fill = NA)) + theme(axis.line = element_line()) + scale_color_manual( values = c("#F2A05C", "#8C5A48", "#5C0424") )state_election_plot_C + theme(panel.background = element_rect(fill = NA)) + theme(legend.background = element_rect(fill = NA)) + theme(axis.line = element_line()) + scale_color_manual( values = c("#F2A05C", "#8C5A48", "#5C0424") ) + scale_color_manual( values = c( hex(HSV( 27, 0.62, 0.95)), hex(HSV( 16, 0.49, 0.55)), hex(HSV(338, 0.96, 0.36)) ) )state_election_plot_C + theme(panel.background = element_rect(fill = NA)) + theme(legend.background = element_rect(fill = NA)) + theme(axis.line = element_line()) + scale_color_manual( values = c("#F2A05C", "#8C5A48", "#5C0424") ) + scale_color_manual( values = c( hex(HSV( 27, 0.62, 0.95)), hex(HSV( 16, 0.49, 0.55)), hex(HSV(338, 0.96, 0.36)) ) ) + scale_color_manual( values = c( hex(HSV( 33, 0.62, 1)), hex(HSV( 16, 0.49, 1)), hex(HSV(338, 0.96, 1)) ) )state_election_plot_C + theme(panel.background = element_rect(fill = NA)) + theme(legend.background = element_rect(fill = NA)) + theme(axis.line = element_line()) + scale_color_manual( values = c("#F2A05C", "#8C5A48", "#5C0424") ) + scale_color_manual( values = c( hex(HSV( 27, 0.62, 0.95)), hex(HSV( 16, 0.49, 0.55)), hex(HSV(338, 0.96, 0.36)) ) ) + scale_color_manual( values = c( hex(HSV( 33, 0.62, 1)), hex(HSV( 16, 0.49, 1)), hex(HSV(338, 0.96, 1)) ) ) + scale_color_manual( values = c( hex(HSV( 33, 1, 0.95)), hex(HSV( 16, 1, 0.55)), hex(HSV(338, 1, 0.36)) ) )state_election_plot_C + theme(panel.background = element_rect(fill = NA)) + theme(legend.background = element_rect(fill = NA)) + theme(axis.line = element_line()) + scale_color_manual( values = c("#F2A05C", "#8C5A48", "#5C0424") ) + scale_color_manual( values = c( hex(HSV( 27, 0.62, 0.95)), hex(HSV( 16, 0.49, 0.55)), hex(HSV(338, 0.96, 0.36)) ) ) + scale_color_manual( values = c( hex(HSV( 33, 0.62, 1)), hex(HSV( 16, 0.49, 1)), hex(HSV(338, 0.96, 1)) ) ) + scale_color_manual( values = c( hex(HSV( 33, 1, 0.95)), hex(HSV( 16, 1, 0.55)), hex(HSV(338, 1, 0.36)) ) ) + geom_line(size = 1.5)state_election_plot_C + theme(panel.background = element_rect(fill = NA)) + theme(legend.background = element_rect(fill = NA)) + theme(axis.line = element_line()) + scale_color_manual( values = c("#F2A05C", "#8C5A48", "#5C0424") ) + scale_color_manual( values = c( hex(HSV( 27, 0.62, 0.95)), hex(HSV( 16, 0.49, 0.55)), hex(HSV(338, 0.96, 0.36)) ) ) + scale_color_manual( values = c( hex(HSV( 33, 0.62, 1)), hex(HSV( 16, 0.49, 1)), hex(HSV(338, 0.96, 1)) ) ) + scale_color_manual( values = c( hex(HSV( 33, 1, 0.95)), hex(HSV( 16, 1, 0.55)), hex(HSV(338, 1, 0.36)) ) ) + geom_line(size = 1.5) + scale_color_manual( values = c("#F2A05C", "#8C5A48", "#5C0424") )state_election_plot_C + theme(panel.background = element_rect(fill = NA)) + theme(legend.background = element_rect(fill = NA)) + theme(axis.line = element_line()) + scale_color_manual( values = c("#F2A05C", "#8C5A48", "#5C0424") ) + scale_color_manual( values = c( hex(HSV( 27, 0.62, 0.95)), hex(HSV( 16, 0.49, 0.55)), hex(HSV(338, 0.96, 0.36)) ) ) + scale_color_manual( values = c( hex(HSV( 33, 0.62, 1)), hex(HSV( 16, 0.49, 1)), hex(HSV(338, 0.96, 1)) ) ) + scale_color_manual( values = c( hex(HSV( 33, 1, 0.95)), hex(HSV( 16, 1, 0.55)), hex(HSV(338, 1, 0.36)) ) ) + geom_line(size = 1.5) + scale_color_manual( values = c("#F2A05C", "#8C5A48", "#5C0424") ) + scale_color_manual(values = desaturate(c("#F2A05C", "#8C5A48", "#5C0424")))state_election_plot_C + theme(panel.background = element_rect(fill = NA)) + theme(legend.background = element_rect(fill = NA)) + theme(axis.line = element_line()) + geom_line(size = 1.5) + ggthemes::scale_color_colorblind()state_election_plot_C + theme(panel.background = element_rect(fill = NA)) + theme(legend.background = element_rect(fill = NA)) + theme(axis.line = element_line()) + geom_line(size = 1.5) + ggsci::scale_color_simpsons()state_election_plot_C + theme(panel.background = element_rect(fill = NA)) + theme(legend.background = element_rect(fill = NA)) + theme(axis.line = element_line()) + geom_line(size = 1.5) + ghibli::scale_color_ghibli_d("SpiritedMedium")state_election_plot_C + theme(panel.background = element_rect(fill = NA)) + theme(legend.background = element_rect(fill = NA)) + theme(axis.line = element_line()) + geom_line(size = 1.5) + scale_color_manual(values = wesanderson::wes_palette("Moonrise2", 3, "discrete"))state_election_plot_C + theme(panel.background = element_rect(fill = NA)) + theme(legend.background = element_rect(fill = NA)) + theme(axis.line = element_line()) + geom_line(size = 1.5) + scale_color_manual(values = LaCroixColoR::lacroix_palette("PeachPear", 3, "discrete"))state_election_plot_C + theme(panel.background = element_rect(fill = NA)) + theme(legend.background = element_rect(fill = NA)) + theme(axis.line = element_line()) + geom_line(size = 1.5) + list(scale_color_manual(values = c("#65657F", "#855F4C", "#556760")), annotation_raster(bernie, xmin = 1986, xmax = 2016, ymin = .4, ymax = .65))state_election_plot_C + theme(panel.background = element_rect(fill = NA)) + theme(legend.background = element_rect(fill = NA)) + theme(axis.line = element_line()) + geom_line(size = 1.5) + palettetown::scale_color_poke(pokemon = "pikachu")state_election_plot_C + theme(panel.background = element_rect(fill = NA)) + theme(legend.background = element_rect(fill = NA)) + theme(axis.line = element_line()) + geom_line(size = 1.5) + theme(plot.background = element_rect(fill = "#ACACAC"), panel.grid = element_blank()) + palettetown::scale_color_poke(pokemon = "pikachu")state_election_plot_C + theme(panel.background = element_rect(fill = NA)) + theme(legend.background = element_rect(fill = NA)) + theme(axis.line = element_line()) + geom_line(size = 1.5) + theme(plot.background = element_rect(fill = "#ACACAC"), panel.grid = element_blank()) + scale_color_manual(values = sequential_hcl(3, palette = "ag_Sunset"))Plot
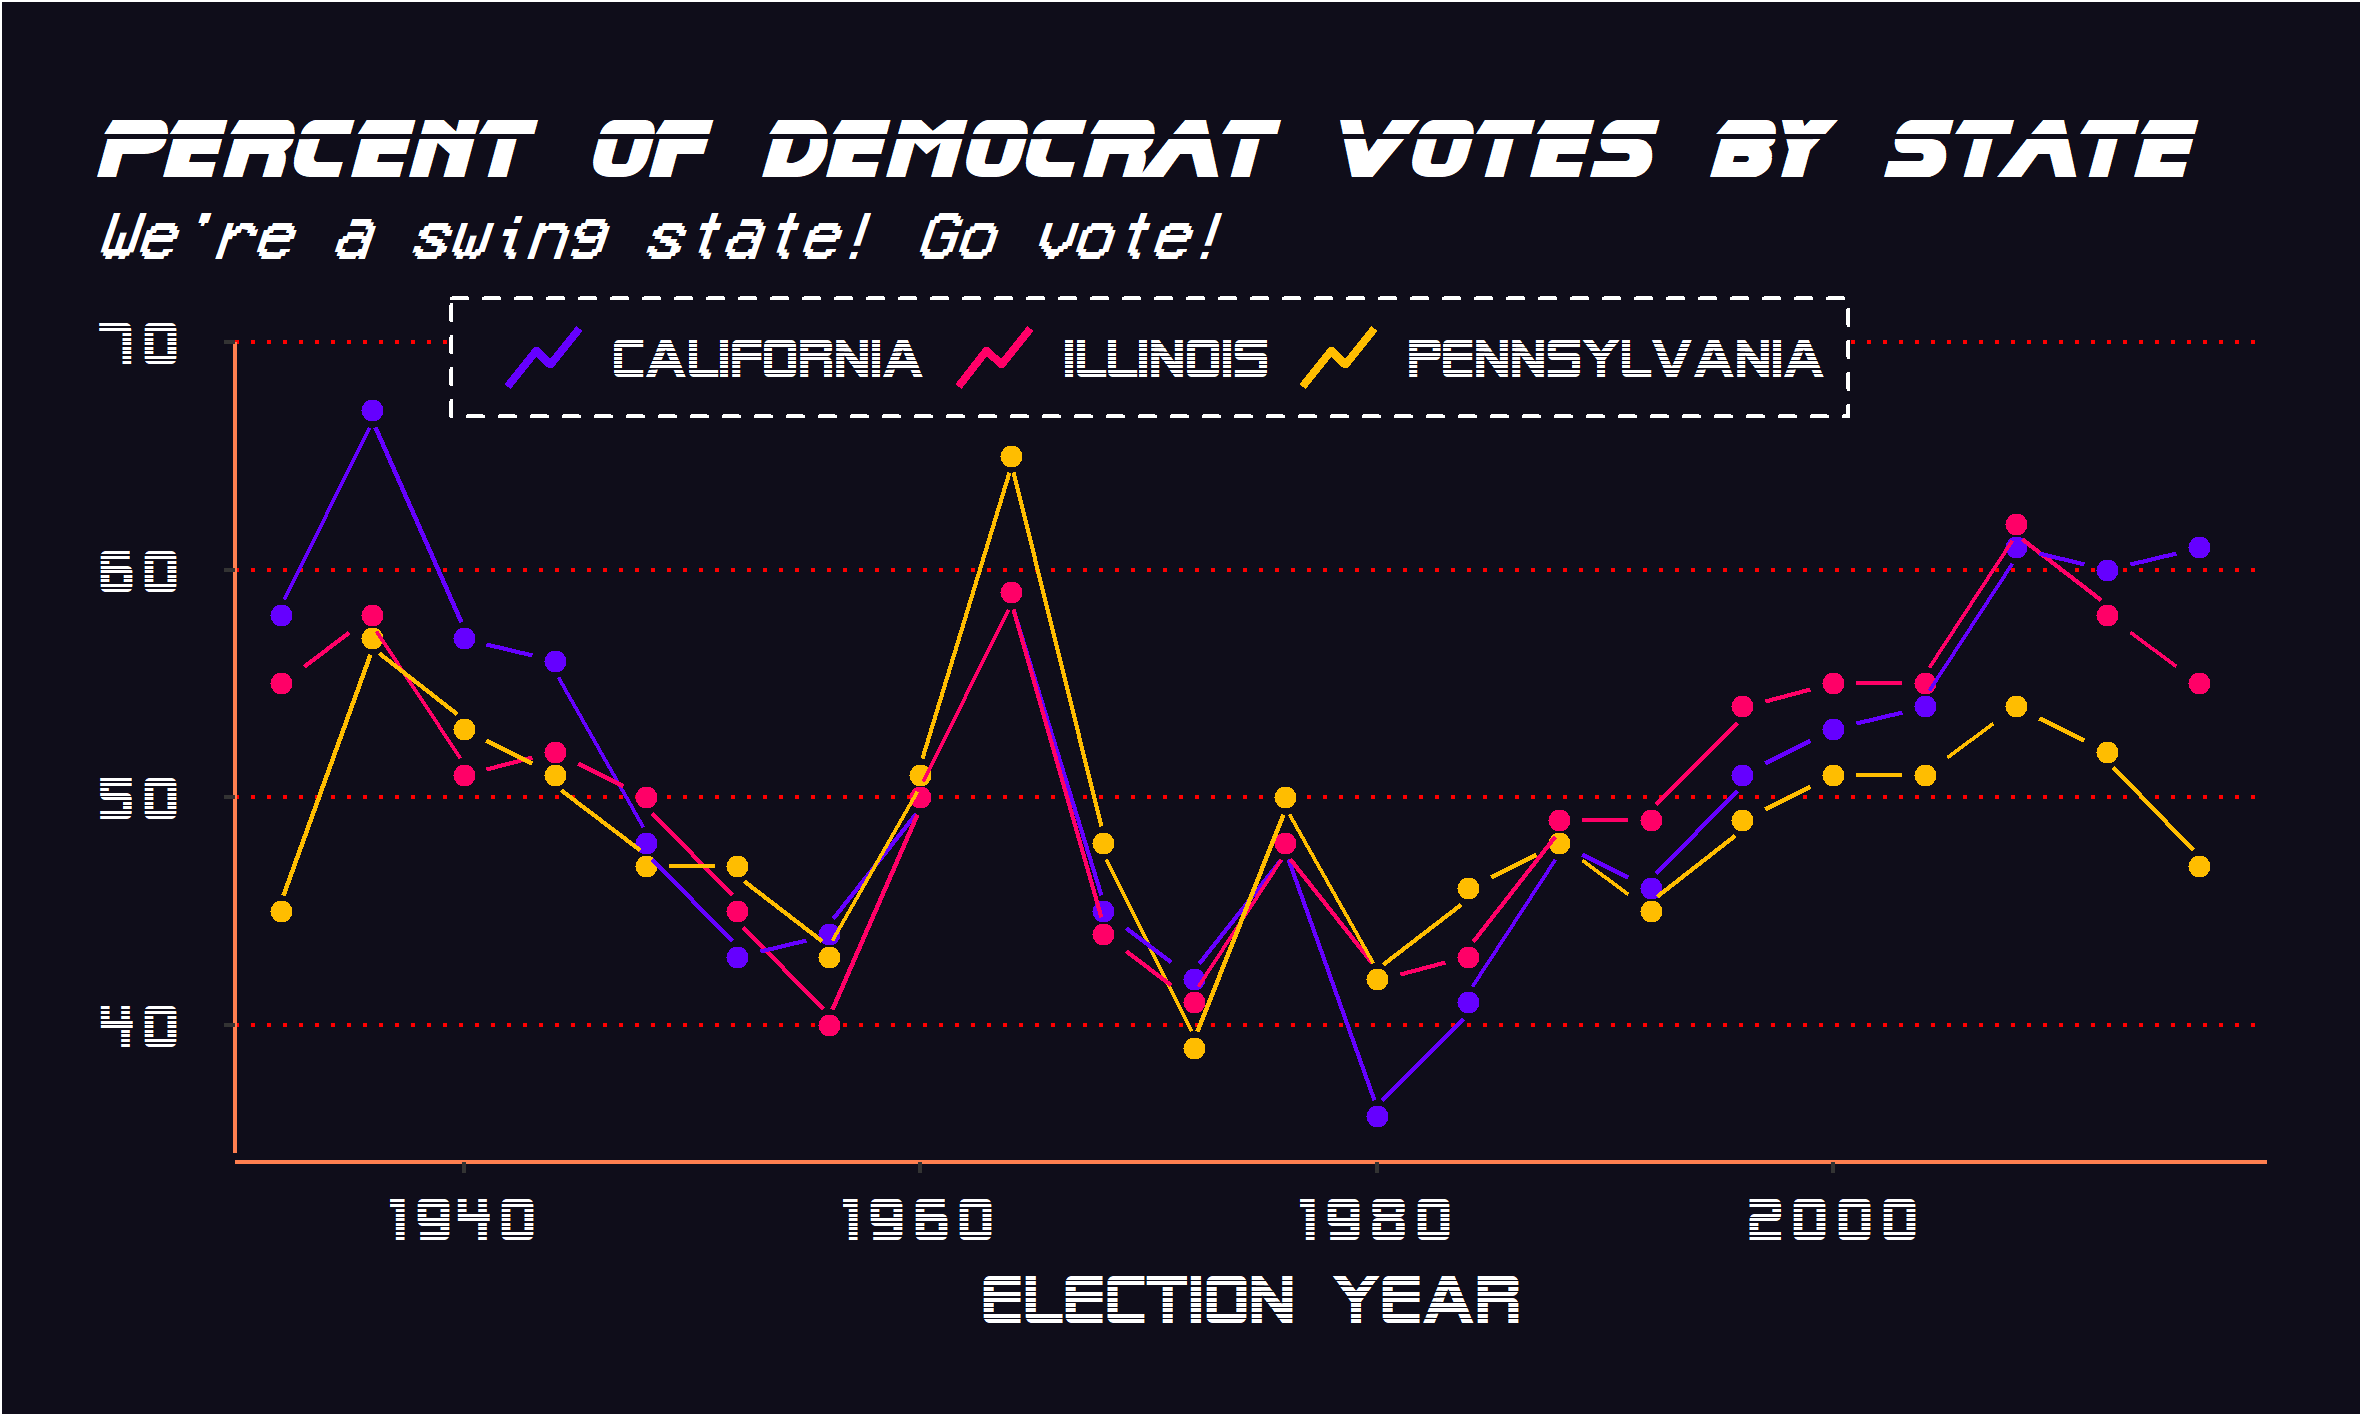
saturated_sunset <- chroma::as.hsv(sequential_hcl(3, palette = "ag_Sunset"))[, 'h'] %>% map_chr(~ hex(HSV(H = .x, S = 1, V = 1)))state_election_plot_C + theme( axis.line = element_line(color = "coral"), axis.text = element_text(color = "white"), legend.background = element_rect(fill = "#0F0D1A", color = "white", size = 0.5, linetype = "dashed"), panel.background = element_rect(fill = NA), panel.grid.major.x = element_blank(), panel.grid.major.y = element_line(color = "red", linetype = "dotted"), panel.grid.minor = element_blank(), plot.background = element_rect(fill = "#0F0D1A"), plot.subtitle = element_text(family = "VCR OSD Mono"), plot.title = element_text(family = "Blade Runner Movie Font"), text = element_text(color = "white", family = "SF Alien Encounters") ) + lemon::coord_capped_cart(left = "top") + lemon::geom_pointline(size = 2, distance = unit(2, 'pt'), key_glyph = "timeseries") + scale_color_manual( values = saturated_sunset, guide = guide_legend(override.aes = list(size = 1)) )state_election_plot_Cstate_election_plot_C + theme( panel.background = element_rect(fill = NA) )state_election_plot_C + theme( panel.background = element_rect(fill = NA) ) + theme( legend.background = element_rect(fill = NA) )state_election_plot_C + theme( panel.background = element_rect(fill = NA) ) + theme( legend.background = element_rect(fill = NA) ) + theme( axis.line = element_line() )state_election_plot_C + theme( panel.background = element_rect(fill = NA) ) + theme( legend.background = element_rect(fill = NA) ) + theme( axis.line = element_line() ) + scale_color_manual( values = c("#e1e1e1", "#e1e1e1", "#2b5e82") )state_election_plot_C + theme( panel.background = element_rect(fill = NA) ) + theme( legend.background = element_rect(fill = NA) ) + theme( axis.line = element_line() ) + scale_color_manual( values = c("#e1e1e1", "#e1e1e1", "#2b5e82") ) + guides( color = guide_none() )state_election_plot_C + theme( panel.background = element_rect(fill = NA) ) + theme( legend.background = element_rect(fill = NA) ) + theme( axis.line = element_line() ) + scale_color_manual( values = c("#e1e1e1", "#e1e1e1", "#2b5e82") ) + guides( color = guide_none() ) + geom_line(size = 1.5)state_election_plot_C + theme( panel.background = element_rect(fill = NA) ) + theme( legend.background = element_rect(fill = NA) ) + theme( axis.line = element_line() ) + scale_color_manual( values = c("#e1e1e1", "#e1e1e1", "#2b5e82") ) + guides( color = guide_none() ) + geom_line(size = 1.5) + theme(plot.subtitle = ggtext::element_markdown())state_election_plot_C + theme( panel.background = element_rect(fill = NA) ) + theme( legend.background = element_rect(fill = NA) ) + theme( axis.line = element_line() ) + scale_color_manual( values = c("#e1e1e1", "#e1e1e1", "#2b5e82") ) + guides( color = guide_none() ) + geom_line(size = 1.5) + theme(plot.subtitle = ggtext::element_markdown()) + labs(subtitle = "<span style='color:#2b5e82'>Pennsylvania</span> is a swing state! Go vote!")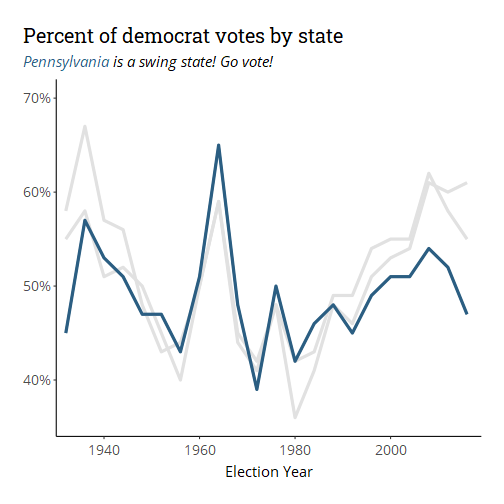
state_election_plot_C + theme( panel.background = element_rect(fill = NA) ) + theme( legend.background = element_rect(fill = NA) ) + theme( axis.line = element_line() ) + scale_color_manual( values = c("#e1e1e1", "#e1e1e1", "#2b5e82") ) + guides( color = guide_none() ) + geom_line(size = 1.5) + theme(plot.subtitle = ggtext::element_markdown()) + labs(subtitle = "<strong style='color:#2b5e82'>Pennsylvania</strong> is a swing state! Go vote!")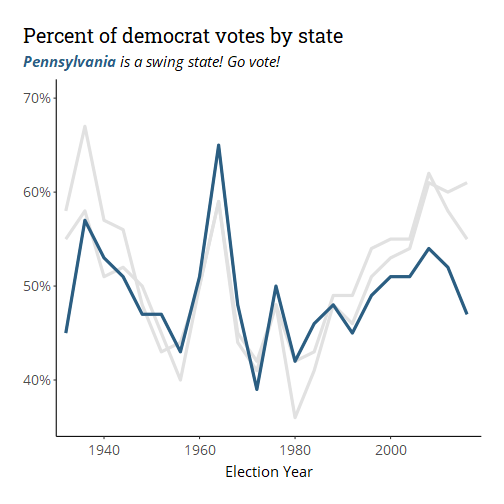
state_election_plot_C + theme( panel.background = element_rect(fill = NA) ) + theme( legend.background = element_rect(fill = NA) ) + theme( axis.line = element_line() ) + scale_color_manual( values = c("#e1e1e1", "#e1e1e1", "#2b5e82") ) + guides( color = guide_none() ) + geom_line(size = 1.5) + theme(plot.subtitle = ggtext::element_markdown()) + labs(subtitle = "<strong style='color:#0E4369'>Pennsylvania</strong> is a swing state! Go vote!")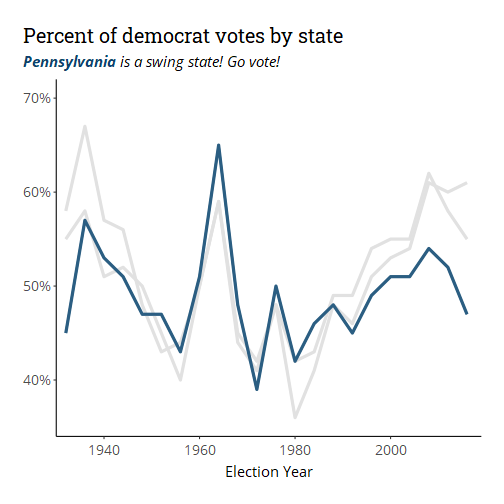
4. Colors v.1 (End!)
state_election_plot_C + geom_line(size = 1.5) + theme( panel.background = element_rect(fill = NA), legend.background = element_rect(fill = NA), axis.line = element_line() ) + scale_color_manual( values = c("#F2A05C", "#8C5A48", "#5C0424") )Save our progress!
state_election_plot_D1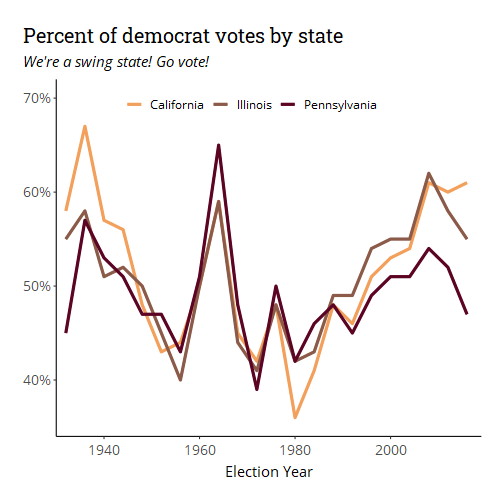
4. Colors v.2 (End!)
state_election_plot_C + geom_line(size = 1.5) + theme( panel.background = element_rect(fill = NA), legend.background = element_rect(fill = NA), axis.line = element_line(), plot.subtitle = element_markdown() ) + guides(color = guide_none()) + scale_color_manual(values = c("#e1e1e1", "#e1e1e1", "#2b5e82")) + labs( subtitle = "<strong style='color:#0E4369'>Pennsylvania</strong> is a swing state! Go vote!" )Save our progress!
state_election_plot_D2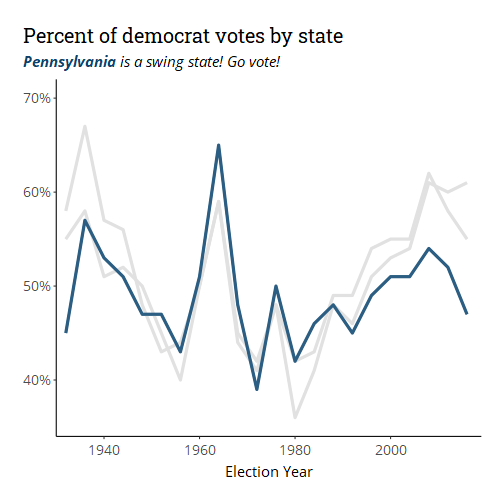
4. Colors (Before-After)
4. Colors (Before-After)

state_election_plot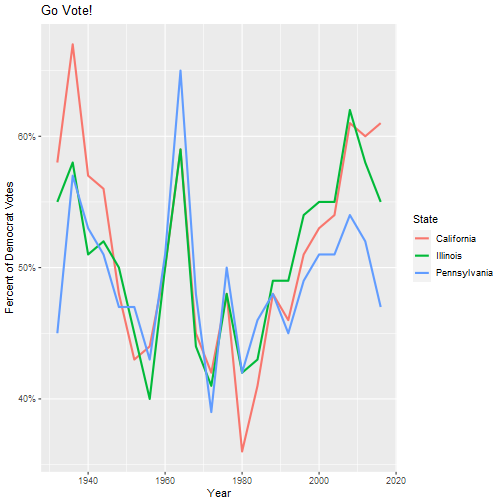
state_election_plot + theme_classic( base_family = "Open Sans", base_size = 15 )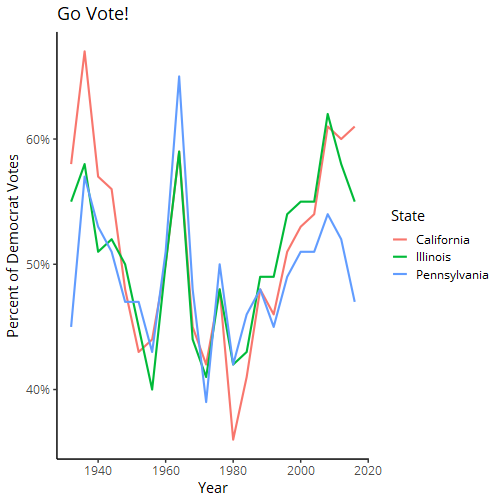
state_election_plot + theme_classic( base_family = "Open Sans", base_size = 15 ) + guides(color = guide_none())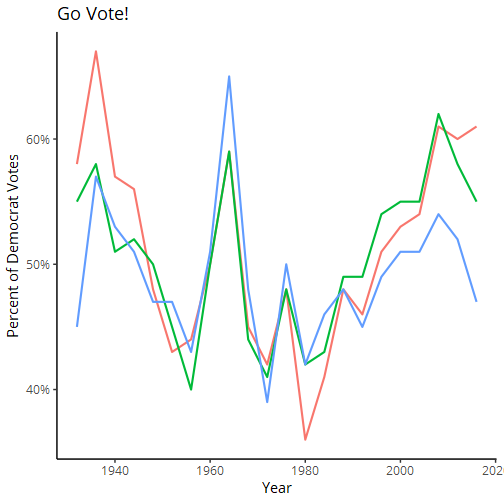
state_election_plot + theme_classic( base_family = "Open Sans", base_size = 15 ) + guides(color = guide_none()) + geom_line(size = 1.5)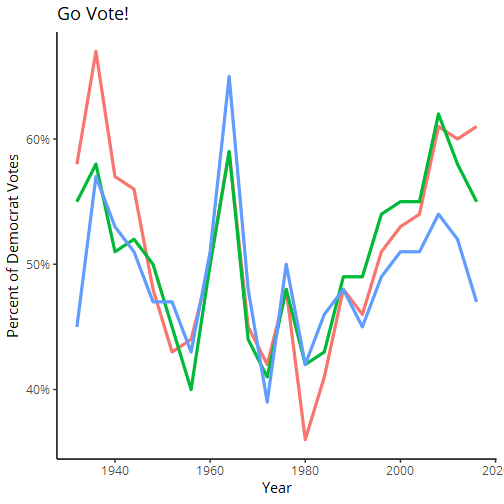
state_election_plot + theme_classic( base_family = "Open Sans", base_size = 15 ) + guides(color = guide_none()) + geom_line(size = 1.5) + scale_color_manual( values = c("#e1e1e1", "#e1e1e1", "#2b5e82") )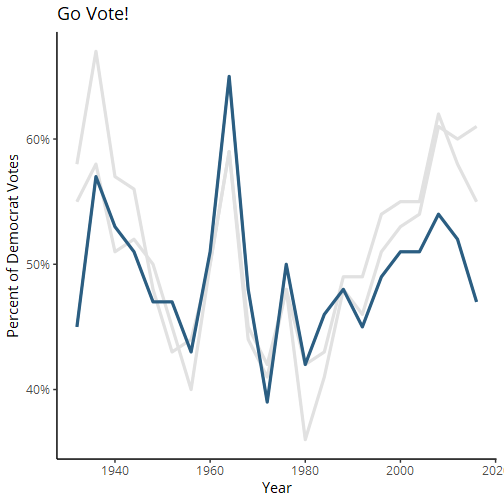
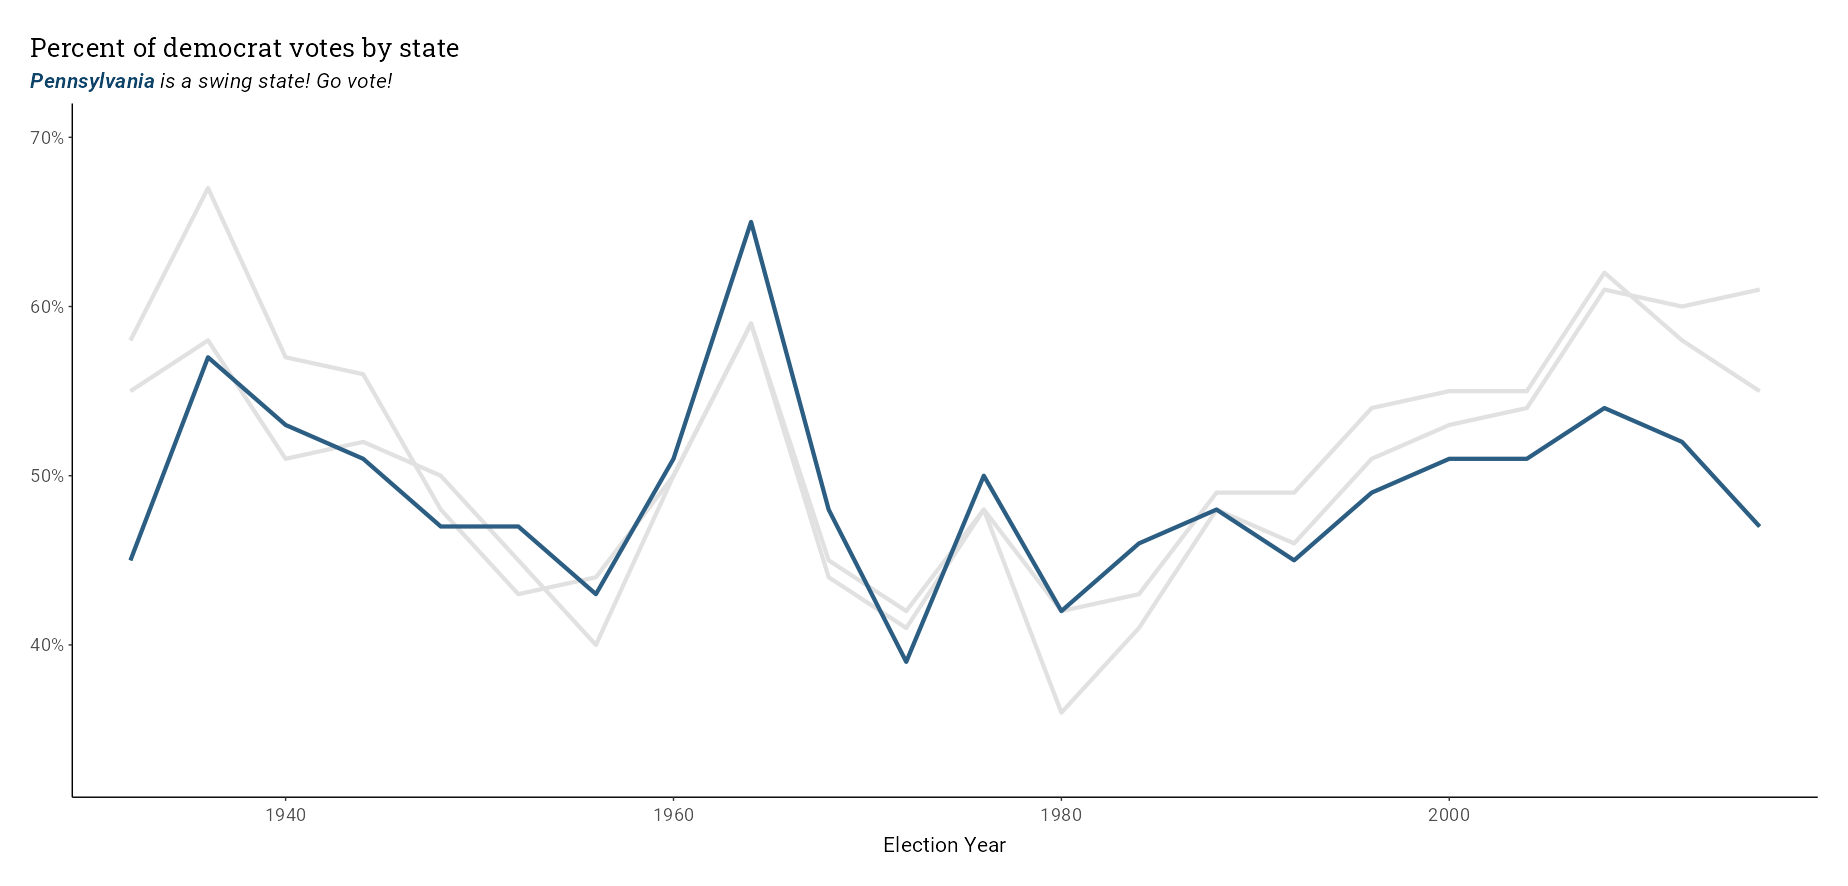
state_election_plot + theme_classic( base_family = "Open Sans", base_size = 15 ) + guides(color = guide_none()) + geom_line(size = 1.5) + scale_color_manual( values = c("#e1e1e1", "#e1e1e1", "#2b5e82") ) + labs( y = NULL, x = "Election Year", title = "Percent of democrat votes by state", subtitle = "<strong style='color:#0E4369'>Pennsylvania</strong> is a swing state! Go vote!" )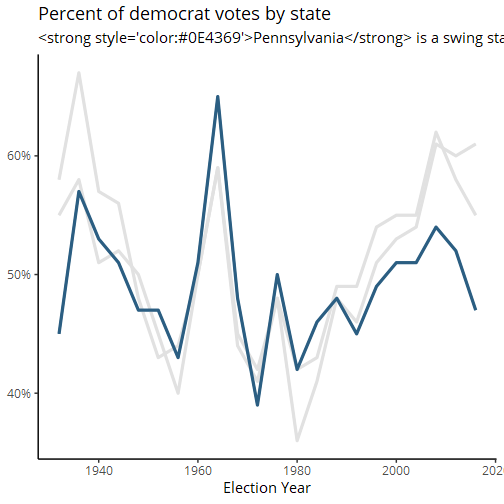
state_election_plot + theme_classic( base_family = "Open Sans", base_size = 15 ) + guides(color = guide_none()) + geom_line(size = 1.5) + scale_color_manual( values = c("#e1e1e1", "#e1e1e1", "#2b5e82") ) + labs( y = NULL, x = "Election Year", title = "Percent of democrat votes by state", subtitle = "<strong style='color:#0E4369'>Pennsylvania</strong> is a swing state! Go vote!" ) + theme( plot.margin = margin(.8, 1, .7, .8, "cm"), plot.title = element_text( family = "Roboto Slab", size = 20, margin = margin(b = .3, unit = "cm") ), plot.title.position = "plot", plot.subtitle = element_markdown( margin = margin(b = .3, unit = "cm") ), axis.title.x = element_text( margin = margin(t = .5, unit = "cm") ) )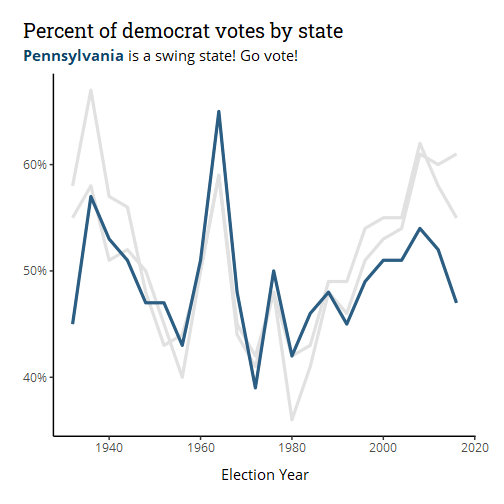
5(?). Plot Quality
5(?). Plot quality: Resolution
Point-and-click method in RStudio
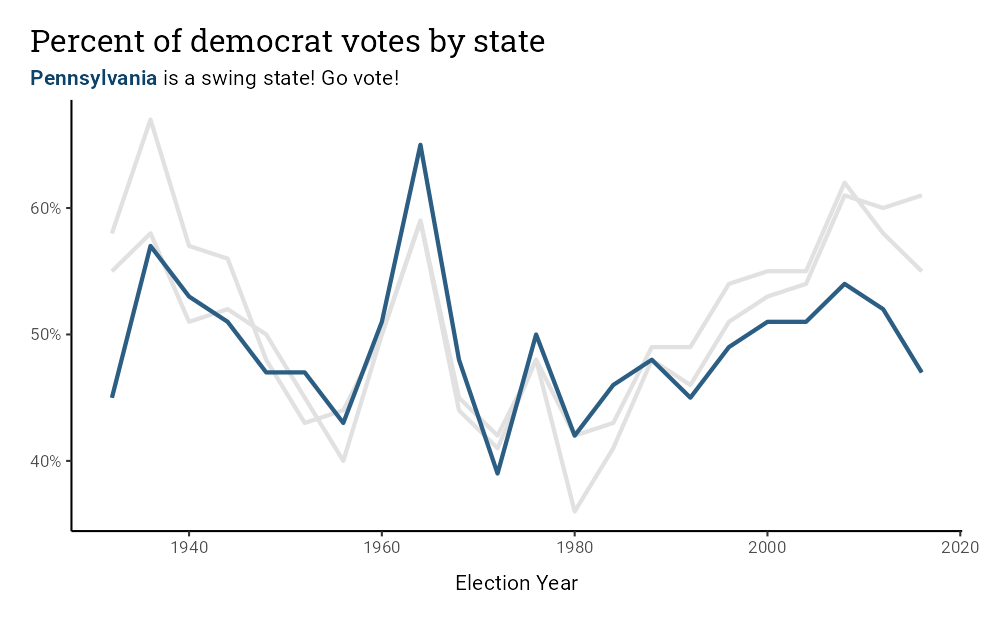
5(?). Plot quality: Scaling
Stretching in RStudio
5(?). Plot quality: Solution
Use the ggsave() function (only works for ggplot2 plots):
Automatically configures sensible defaults
Makes your figures fully reproducible!
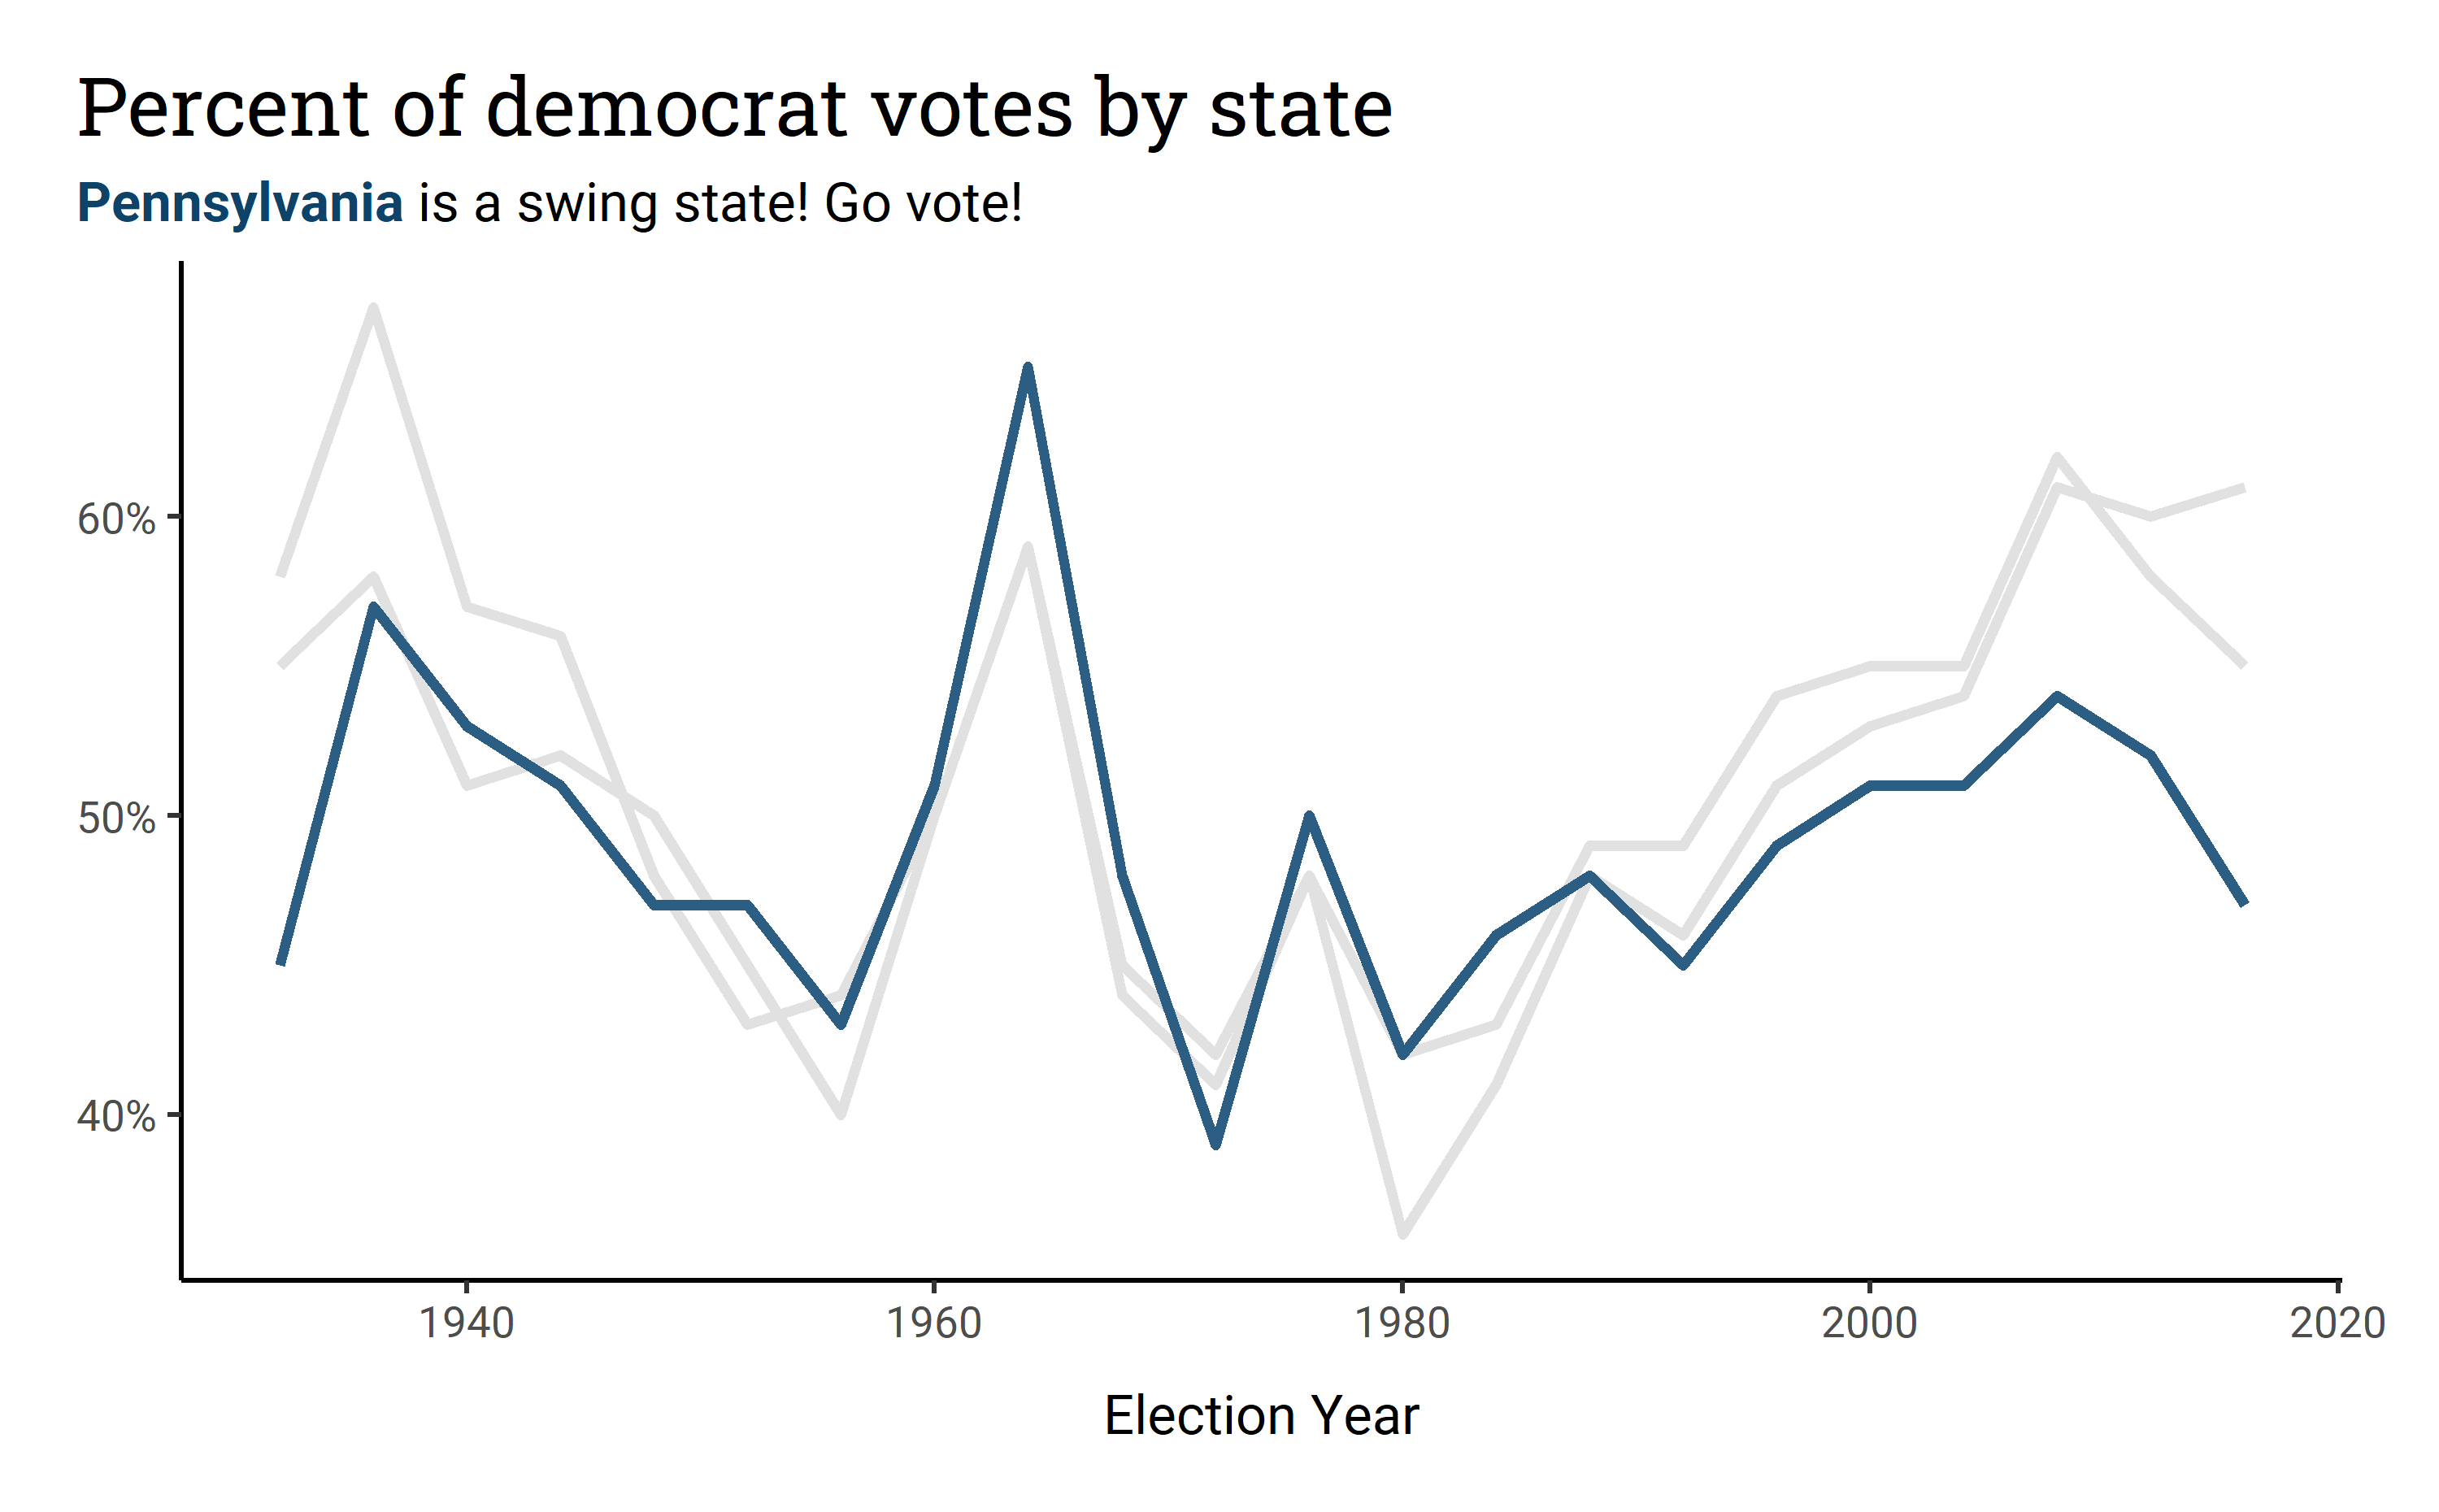
ggsave("highres.png", p, width = 10, height = 6.2, units = "in", dpi = 300) # png formatggsave("highres.pdf", p, width = 10, height = 6.2, units = "in", device = cairo_pdf) # pdf format w/ Cairo5(?). Plot quality: Solution
Use the ggsave() function (only works for ggplot2 plots):
Automatically configures sensible defaults
Makes your figures fully reproducible!
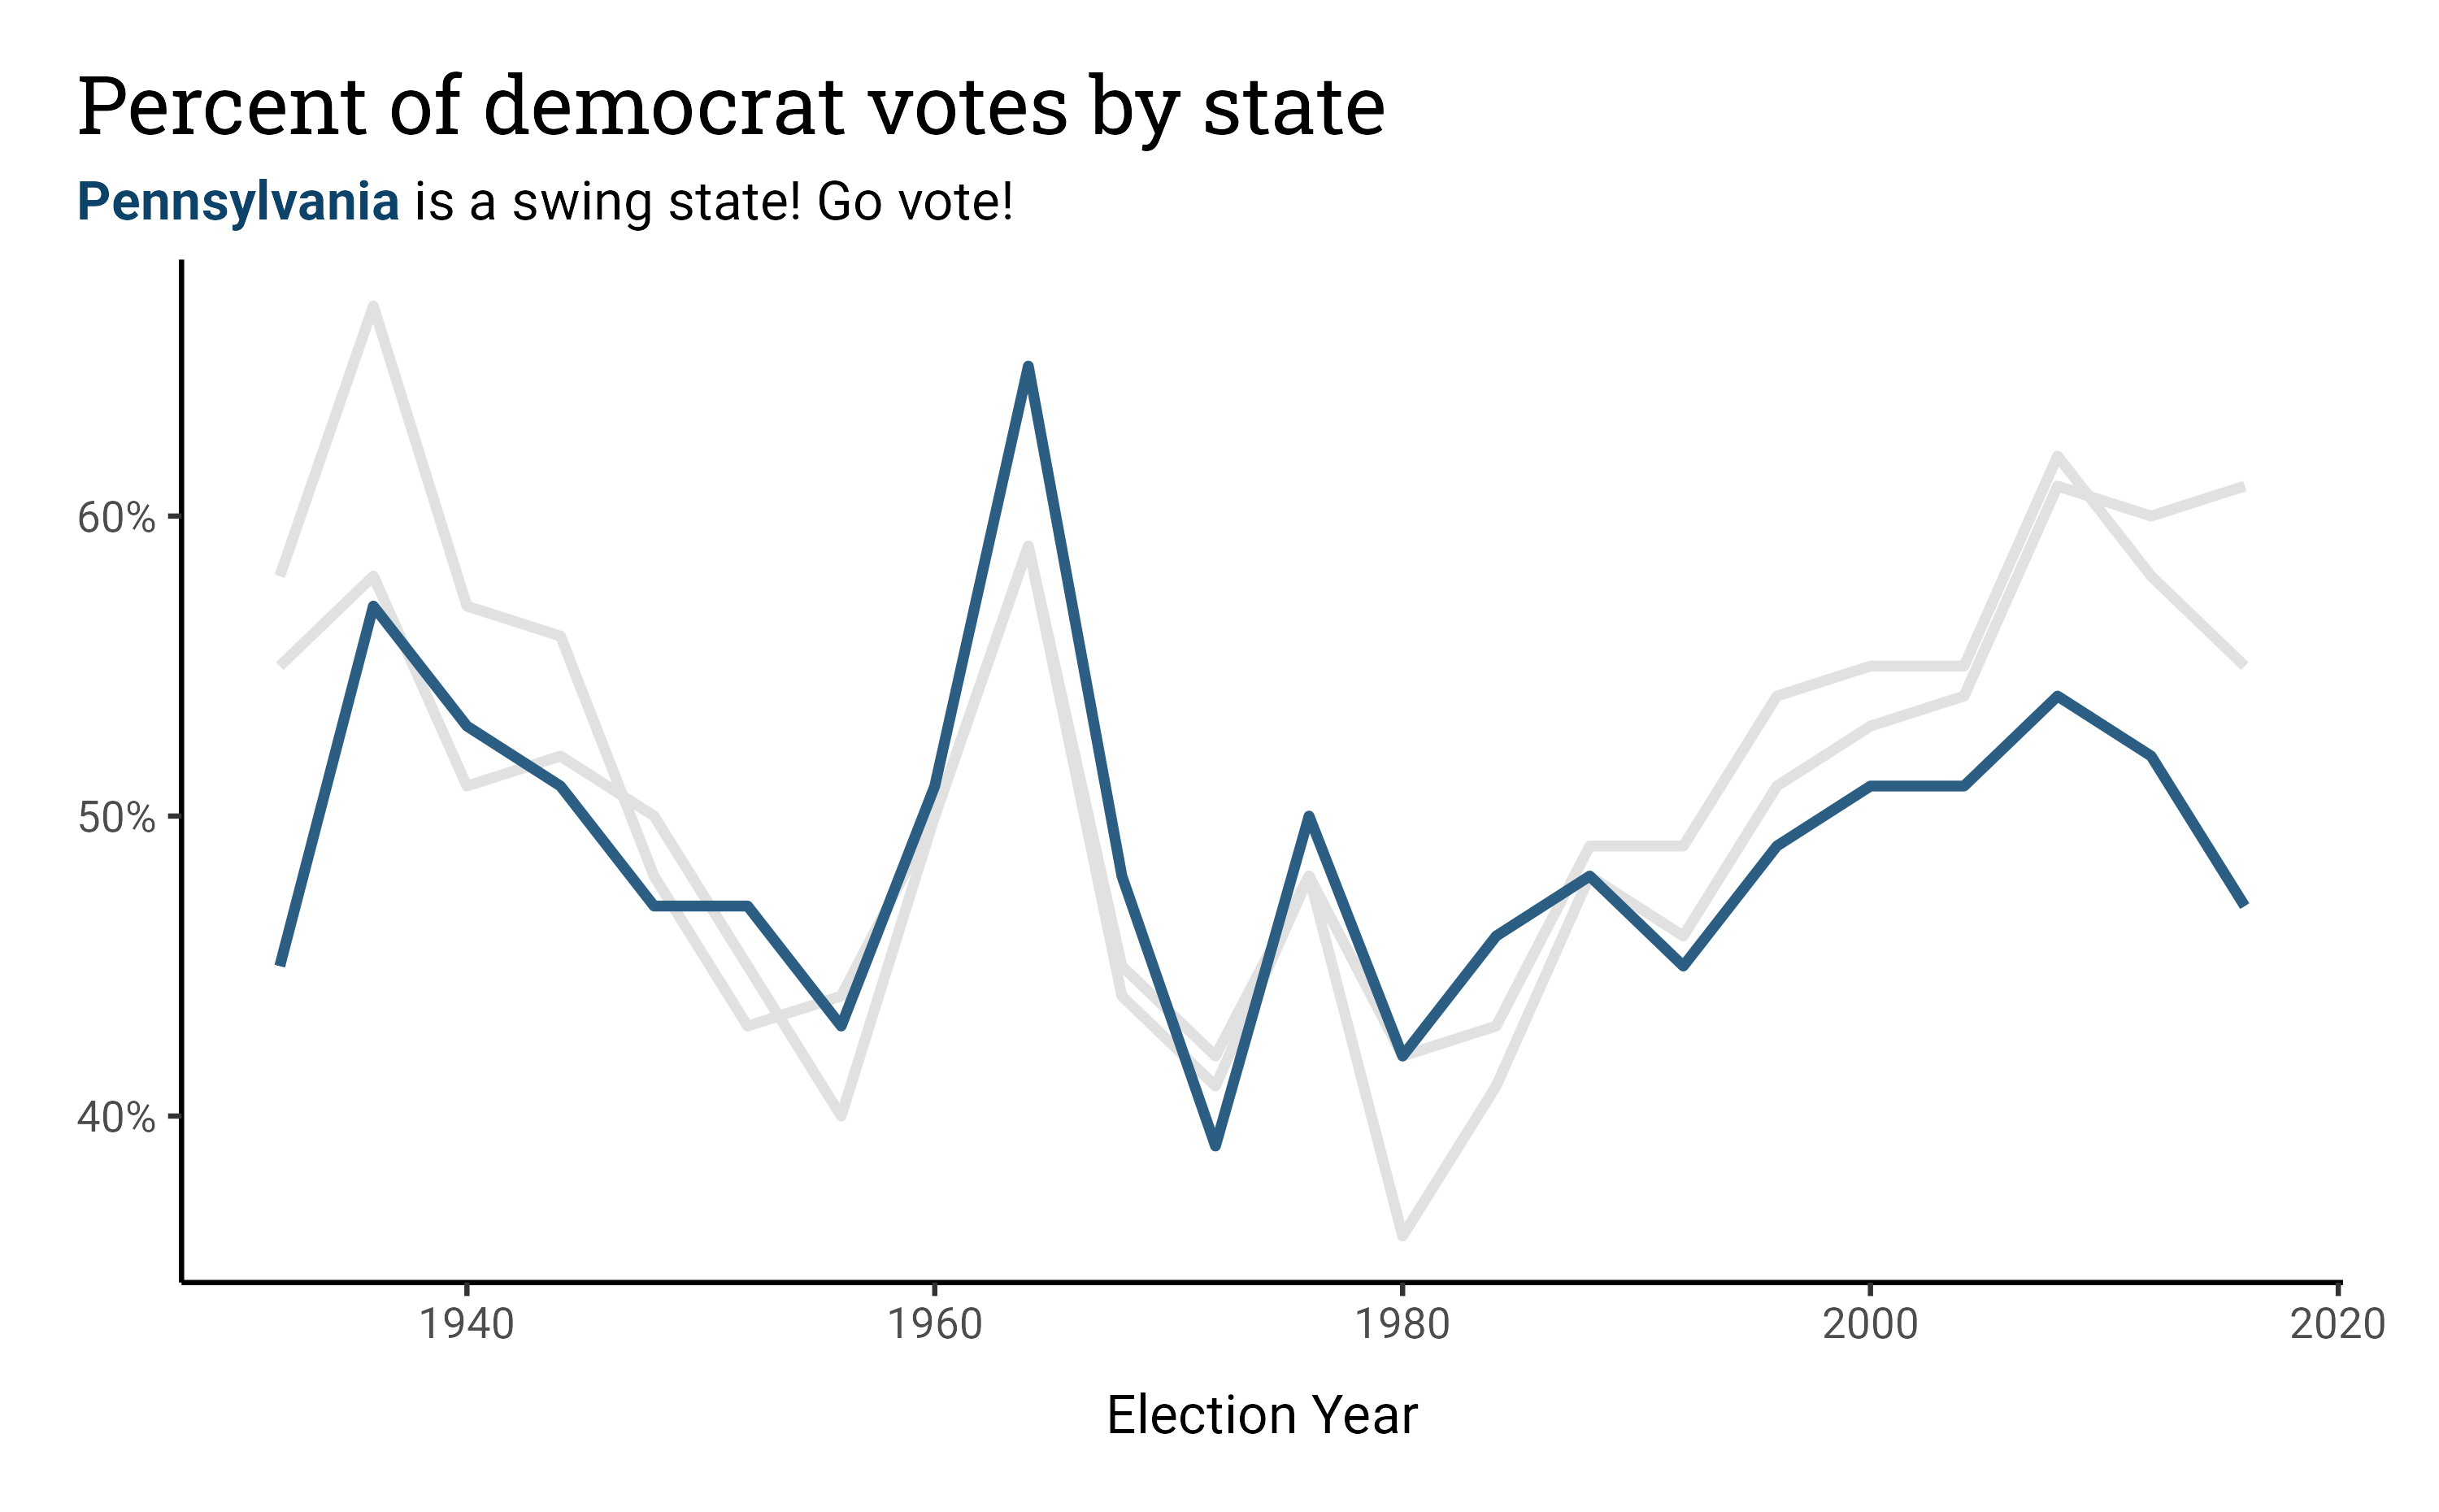
ggsave("highres.png", p, width = 10, height = 6.2, units = "in", dpi = 300) # png formatggsave("highres.pdf", p, width = 10, height = 6.2, units = "in", device = cairo_pdf) # pdf format w/ CairoUse better-quality, OS-independent graphic devices (works for any figure):
library(ragg) # R interface to the AGG device - https://github.com/r-lib/ragg# Step 1: initialize deviceagg_png("highres_agg.png", width = 10, height = 6.2, units = "in")# Step 2: plotplot(p)# Step 3: close deviceinvisible(dev.off())ggsave() png
ggsave() pdf
ragg png
5(?). Plot quality: Takeaways
1. Plot objects are not images
object.size(state_election_plot_D2) 34032 bytesfs::dir_info(path = "img", regexp = "point-and-click.png")$size 43.6K2. The conversion of plot to image is not neutral
Depends on dimensions, resolution, type of graphic device/operating system, etc.
Exert full control over the process to avoid any surprises at the end!
Useful reference: https://bookdown.org/rdpeng/exdata/graphics-devices.html
Showcasing
First, globally set our theme!
You can set global theme with theme_set() and theme_update():
theme_set()takes a custom theme as a argument (e.g.,theme_bw())
theme_update()takes individual theme elements as arguments and updates the current theme
theme_get()returns the current theme
theme_set( theme_classic( base_family = "Open Sans", base_size = 15 ))theme_update( plot.margin = margin(.8, 1, .7, .8, "cm"), plot.title = element_text( family = "Roboto Slab", size = 20, margin = margin(b = .5, unit = "cm") ), plot.title.position = "plot", axis.title.x = element_text( margin = margin(t = .5, unit = "cm") ))Minimal Designs
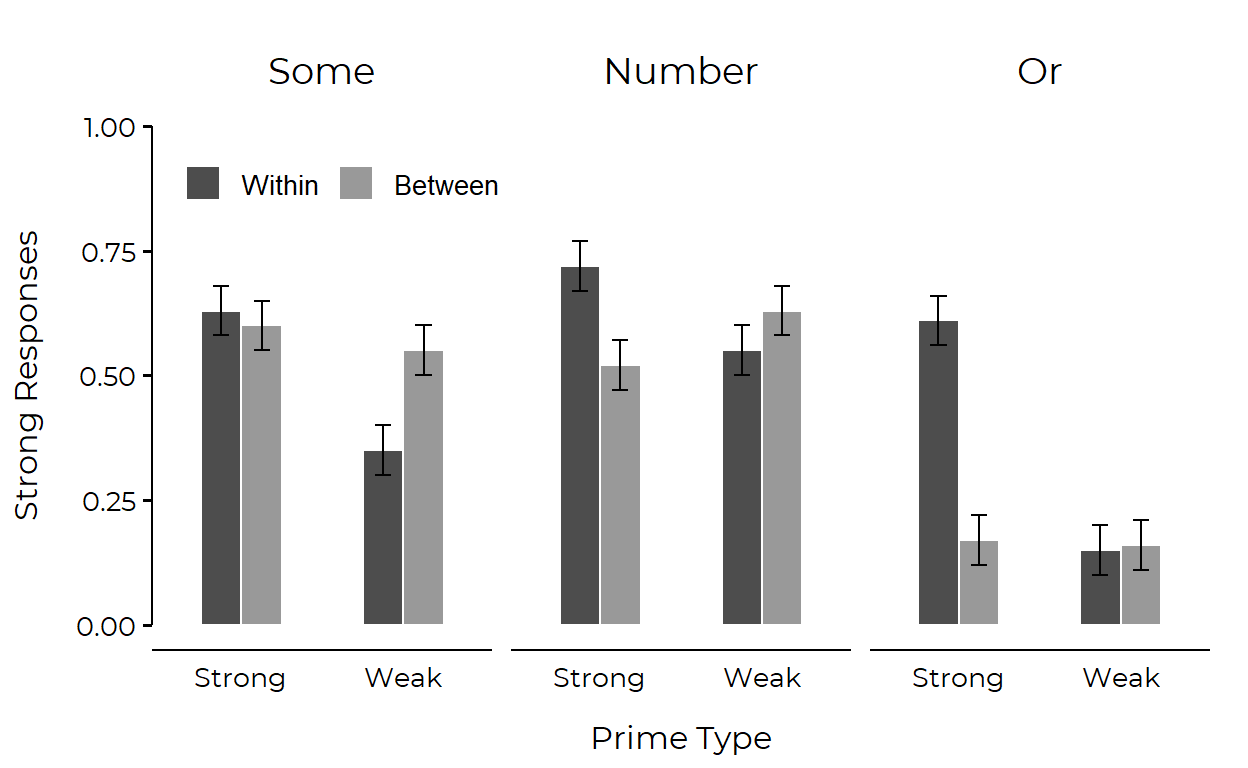
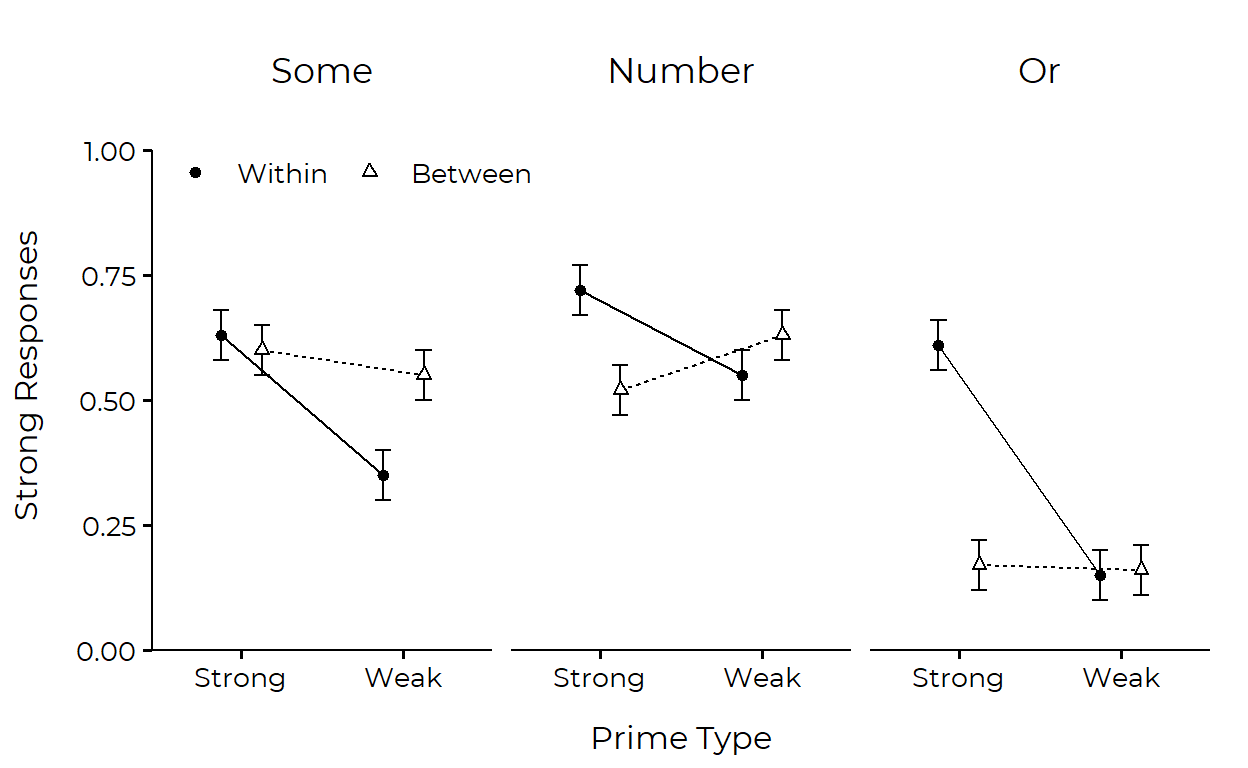
read_csv("https://raw.githubusercontent.com/yjunechoe/Semantic-Persistence/master/processed.csv") # A tibble: 4,516 x 10 Value Item Cond Group Subject Time Answer Accuracy Type logRT <chr> <chr> <chr> <chr> <chr> <dbl> <chr> <dbl> <chr> <dbl> 1 Yes Awaken~ Subje~ B 5cfa77e907f7dd~ 917 No 0 Criti~ 6.82 2 No Awaken~ Subje~ B 5c1d21196036e4~ 2624 No 1 Criti~ 7.87 3 No Awaken~ Subje~ B 5d730aab6b4b16~ 2809 No 1 Criti~ 7.94 4 No Awaken~ Subje~ B 5ddef0fae454cd~ 1587 No 1 Criti~ 7.37 5 No Awaken~ Subje~ B 5e7a8e8b11bf56~ 1697 No 1 Criti~ 7.44 6 No Awaken~ Verb A 5d4613a2da9cb6~ 1484 No 1 Criti~ 7.30 7 No Awaken~ Verb A 579e1e2b275be6~ 1556 No 1 Criti~ 7.35 8 No Awaken~ Verb A 5dfe69ed11d879~ 1699 No 1 Criti~ 7.44 9 No Awaken~ Verb A 5b9442cecd3808~ 2159 No 1 Criti~ 7.68 10 No Awaken~ Verb A 5e7f3328849917~ 1132 No 1 Criti~ 7.03 # ... with 4,506 more rowsread_csv("https://raw.githubusercontent.com/yjunechoe/Semantic-Persistence/master/processed.csv") %>% filter(Type == "Critical") # A tibble: 1,466 x 10 Value Item Cond Group Subject Time Answer Accuracy Type logRT <chr> <chr> <chr> <chr> <chr> <dbl> <chr> <dbl> <chr> <dbl> 1 Yes Awaken~ Subje~ B 5cfa77e907f7dd~ 917 No 0 Criti~ 6.82 2 No Awaken~ Subje~ B 5c1d21196036e4~ 2624 No 1 Criti~ 7.87 3 No Awaken~ Subje~ B 5d730aab6b4b16~ 2809 No 1 Criti~ 7.94 4 No Awaken~ Subje~ B 5ddef0fae454cd~ 1587 No 1 Criti~ 7.37 5 No Awaken~ Subje~ B 5e7a8e8b11bf56~ 1697 No 1 Criti~ 7.44 6 No Awaken~ Verb A 5d4613a2da9cb6~ 1484 No 1 Criti~ 7.30 7 No Awaken~ Verb A 579e1e2b275be6~ 1556 No 1 Criti~ 7.35 8 No Awaken~ Verb A 5dfe69ed11d879~ 1699 No 1 Criti~ 7.44 9 No Awaken~ Verb A 5b9442cecd3808~ 2159 No 1 Criti~ 7.68 10 No Awaken~ Verb A 5e7f3328849917~ 1132 No 1 Criti~ 7.03 # ... with 1,456 more rowsread_csv("https://raw.githubusercontent.com/yjunechoe/Semantic-Persistence/master/processed.csv") %>% filter(Type == "Critical") %>% group_by(Cond, Group) # A tibble: 1,466 x 10 # Groups: Cond, Group [4] Value Item Cond Group Subject Time Answer Accuracy Type logRT <chr> <chr> <chr> <chr> <chr> <dbl> <chr> <dbl> <chr> <dbl> 1 Yes Awaken~ Subje~ B 5cfa77e907f7dd~ 917 No 0 Criti~ 6.82 2 No Awaken~ Subje~ B 5c1d21196036e4~ 2624 No 1 Criti~ 7.87 3 No Awaken~ Subje~ B 5d730aab6b4b16~ 2809 No 1 Criti~ 7.94 4 No Awaken~ Subje~ B 5ddef0fae454cd~ 1587 No 1 Criti~ 7.37 5 No Awaken~ Subje~ B 5e7a8e8b11bf56~ 1697 No 1 Criti~ 7.44 6 No Awaken~ Verb A 5d4613a2da9cb6~ 1484 No 1 Criti~ 7.30 7 No Awaken~ Verb A 579e1e2b275be6~ 1556 No 1 Criti~ 7.35 8 No Awaken~ Verb A 5dfe69ed11d879~ 1699 No 1 Criti~ 7.44 9 No Awaken~ Verb A 5b9442cecd3808~ 2159 No 1 Criti~ 7.68 10 No Awaken~ Verb A 5e7f3328849917~ 1132 No 1 Criti~ 7.03 # ... with 1,456 more rowsread_csv("https://raw.githubusercontent.com/yjunechoe/Semantic-Persistence/master/processed.csv") %>% filter(Type == "Critical") %>% group_by(Cond, Group) %>% summarize(Accuracy = mean(Accuracy, na.rm = TRUE), .groups = 'drop') # A tibble: 4 x 3 Cond Group Accuracy * <chr> <chr> <dbl> 1 Subject A 0.875 2 Subject B 0.780 3 Verb A 0.846 4 Verb B 0.710read_csv("https://raw.githubusercontent.com/yjunechoe/Semantic-Persistence/master/processed.csv") %>% filter(Type == "Critical") %>% group_by(Cond, Group) %>% summarize(Accuracy = mean(Accuracy, na.rm = TRUE), .groups = 'drop') %>% ggplot(aes(x = Cond, y = Accuracy, fill = Group))read_csv("https://raw.githubusercontent.com/yjunechoe/Semantic-Persistence/master/processed.csv") %>% filter(Type == "Critical") %>% group_by(Cond, Group) %>% summarize(Accuracy = mean(Accuracy, na.rm = TRUE), .groups = 'drop') %>% ggplot(aes(x = Cond, y = Accuracy, fill = Group)) + geom_col(position = "dodge", color = "white", width = .7, size = 2)read_csv("https://raw.githubusercontent.com/yjunechoe/Semantic-Persistence/master/processed.csv") %>% filter(Type == "Critical") %>% group_by(Cond, Group) %>% summarize(Accuracy = mean(Accuracy, na.rm = TRUE), .groups = 'drop') %>% ggplot(aes(x = Cond, y = Accuracy, fill = Group)) + geom_col(position = "dodge", color = "white", width = .7, size = 2) + scale_fill_manual(values = c("grey30", "grey70"))read_csv("https://raw.githubusercontent.com/yjunechoe/Semantic-Persistence/master/processed.csv") %>% filter(Type == "Critical") %>% group_by(Cond, Group) %>% summarize(Accuracy = mean(Accuracy, na.rm = TRUE), .groups = 'drop') %>% ggplot(aes(x = Cond, y = Accuracy, fill = Group)) + geom_col(position = "dodge", color = "white", width = .7, size = 2) + scale_fill_manual(values = c("grey30", "grey70")) + labs( title = "Accuracy on Comprehension Task", x = "Pitch Accent Condition", y = NULL, fill = "Experiment Group" )read_csv("https://raw.githubusercontent.com/yjunechoe/Semantic-Persistence/master/processed.csv") %>% filter(Type == "Critical") %>% group_by(Cond, Group) %>% summarize(Accuracy = mean(Accuracy, na.rm = TRUE), .groups = 'drop') %>% ggplot(aes(x = Cond, y = Accuracy, fill = Group)) + geom_col(position = "dodge", color = "white", width = .7, size = 2) + scale_fill_manual(values = c("grey30", "grey70")) + labs( title = "Accuracy on Comprehension Task", x = "Pitch Accent Condition", y = NULL, fill = "Experiment Group" ) + coord_cartesian(ylim = c(0.5, 1))read_csv("https://raw.githubusercontent.com/yjunechoe/Semantic-Persistence/master/processed.csv") %>% filter(Type == "Critical") %>% group_by(Cond, Group) %>% summarize(Accuracy = mean(Accuracy, na.rm = TRUE), .groups = 'drop') %>% ggplot(aes(x = Cond, y = Accuracy, fill = Group)) + geom_col(position = "dodge", color = "white", width = .7, size = 2) + scale_fill_manual(values = c("grey30", "grey70")) + labs( title = "Accuracy on Comprehension Task", x = "Pitch Accent Condition", y = NULL, fill = "Experiment Group" ) + coord_cartesian(ylim = c(0.5, 1)) + guides(fill = guide_legend(direction = "horizontal", title.position = "top"))read_csv("https://raw.githubusercontent.com/yjunechoe/Semantic-Persistence/master/processed.csv") %>% filter(Type == "Critical") %>% group_by(Cond, Group) %>% summarize(Accuracy = mean(Accuracy, na.rm = TRUE), .groups = 'drop') %>% ggplot(aes(x = Cond, y = Accuracy, fill = Group)) + geom_col(position = "dodge", color = "white", width = .7, size = 2) + scale_fill_manual(values = c("grey30", "grey70")) + labs( title = "Accuracy on Comprehension Task", x = "Pitch Accent Condition", y = NULL, fill = "Experiment Group" ) + coord_cartesian(ylim = c(0.5, 1)) + guides(fill = guide_legend(direction = "horizontal", title.position = "top")) + theme( axis.ticks.x = element_blank(), axis.text.x = element_text(color = "black", margin = margin(t = .2, unit = "cm")), legend.position = c(.3, .93), plot.title = element_text( margin = margin(b = 1, unit = "cm") ) )read_csv("https://raw.githubusercontent.com/yjunechoe/Semantic-Persistence/master/processed.csv") %>% filter(Type == "Critical") %>% group_by(Cond, Group) %>% summarize(Accuracy = mean(Accuracy, na.rm = TRUE), .groups = 'drop') %>% ggplot(aes(x = Cond, y = Accuracy, fill = Group)) + geom_col(position = "dodge", color = "white", width = .7, size = 2) + scale_fill_manual(values = c("grey30", "grey70")) + labs( title = "Accuracy on Comprehension Task", x = "Pitch Accent Condition", y = NULL, fill = "Experiment Group" ) + coord_cartesian(ylim = c(0.5, 1)) + guides(fill = guide_legend(direction = "horizontal", title.position = "top")) + theme( axis.ticks.x = element_blank(), axis.text.x = element_text(color = "black", margin = margin(t = .2, unit = "cm")), legend.position = c(.3, .93), plot.title = element_text( margin = margin(b = 1, unit = "cm") ) ) + scale_y_continuous( expand = expansion(0, 0), labels = percent_format(accuracy = 1) )p <- read_csv("https://raw.githubusercontent.com/yjunechoe/Semantic-Persistence/master/processed.csv") %>% filter(Type == "Critical") %>% group_by(Cond, Group) %>% summarize(Accuracy = mean(Accuracy, na.rm = TRUE), .groups = 'drop') %>% ggplot(aes(x = Cond, y = Accuracy, fill = Group)) + geom_col(position = "dodge", color = "white", width = .7, size = 2) + scale_fill_manual(values = c("grey30", "grey70")) + labs( title = "Comprehension Task", x = "Pitch Accent Condition", y = NULL, fill = "Experiment Group" ) + coord_cartesian(ylim = c(0.5, 1)) + guides(fill = guide_legend(direction = "horizontal", title.position = "top")) + theme( axis.ticks.x = element_blank(), axis.text.x = element_text(color = "black", margin = margin(t = .2, unit = "cm")), legend.position = c(.3, .93), plot.title = element_text( margin = margin(b = 1.5, unit = "cm"), hjust = .5 ), plot.margin = margin(.8, 1, .7, 1.2, "cm") ) + scale_y_continuous( expand = expansion(0, 0), labels = percent_format(accuracy = 1) )library(cowplot)ggdraw(p) + draw_label("Accuracy", x = .12, y = .88, fontfamily = "Open Sans", size = 14, color = "#2D2D2D")df <- crossing(level_1 = fct_inorder(c("Within", "Between")), level_2 = fct_inorder(c("Some", "Number", "Or")), level_3 = factor(c("Strong", "Weak")))df$barheight <- c(.63, .35, .72, .55, .61, .15, .60, .55, .52, .63, .17, .16)df %>% ggplot(aes(level_3, barheight)) + geom_col( aes(fill = level_3), show.legend = FALSE ) + geom_errorbar( aes(ymin = barheight - .05, ymax = barheight + .05), width = .1) + facet_grid(level_2 ~ level_1) + #<<< theme_bw() + scale_fill_manual(values = c('grey40', 'grey80')) + ylim(0, 1) + labs( y = "Proportion of Strong Responses", x = "Prime Type") + theme_bw()
Plot composition
# 3 column layout with `wrap_plots()`plot_list <- list(state_election_plot, state_election_plot_A, state_election_plot_B, state_election_plot_C, state_election_plot_D1, state_election_plot_D2)patchwork::wrap_plots(plot_list, ncol = 3)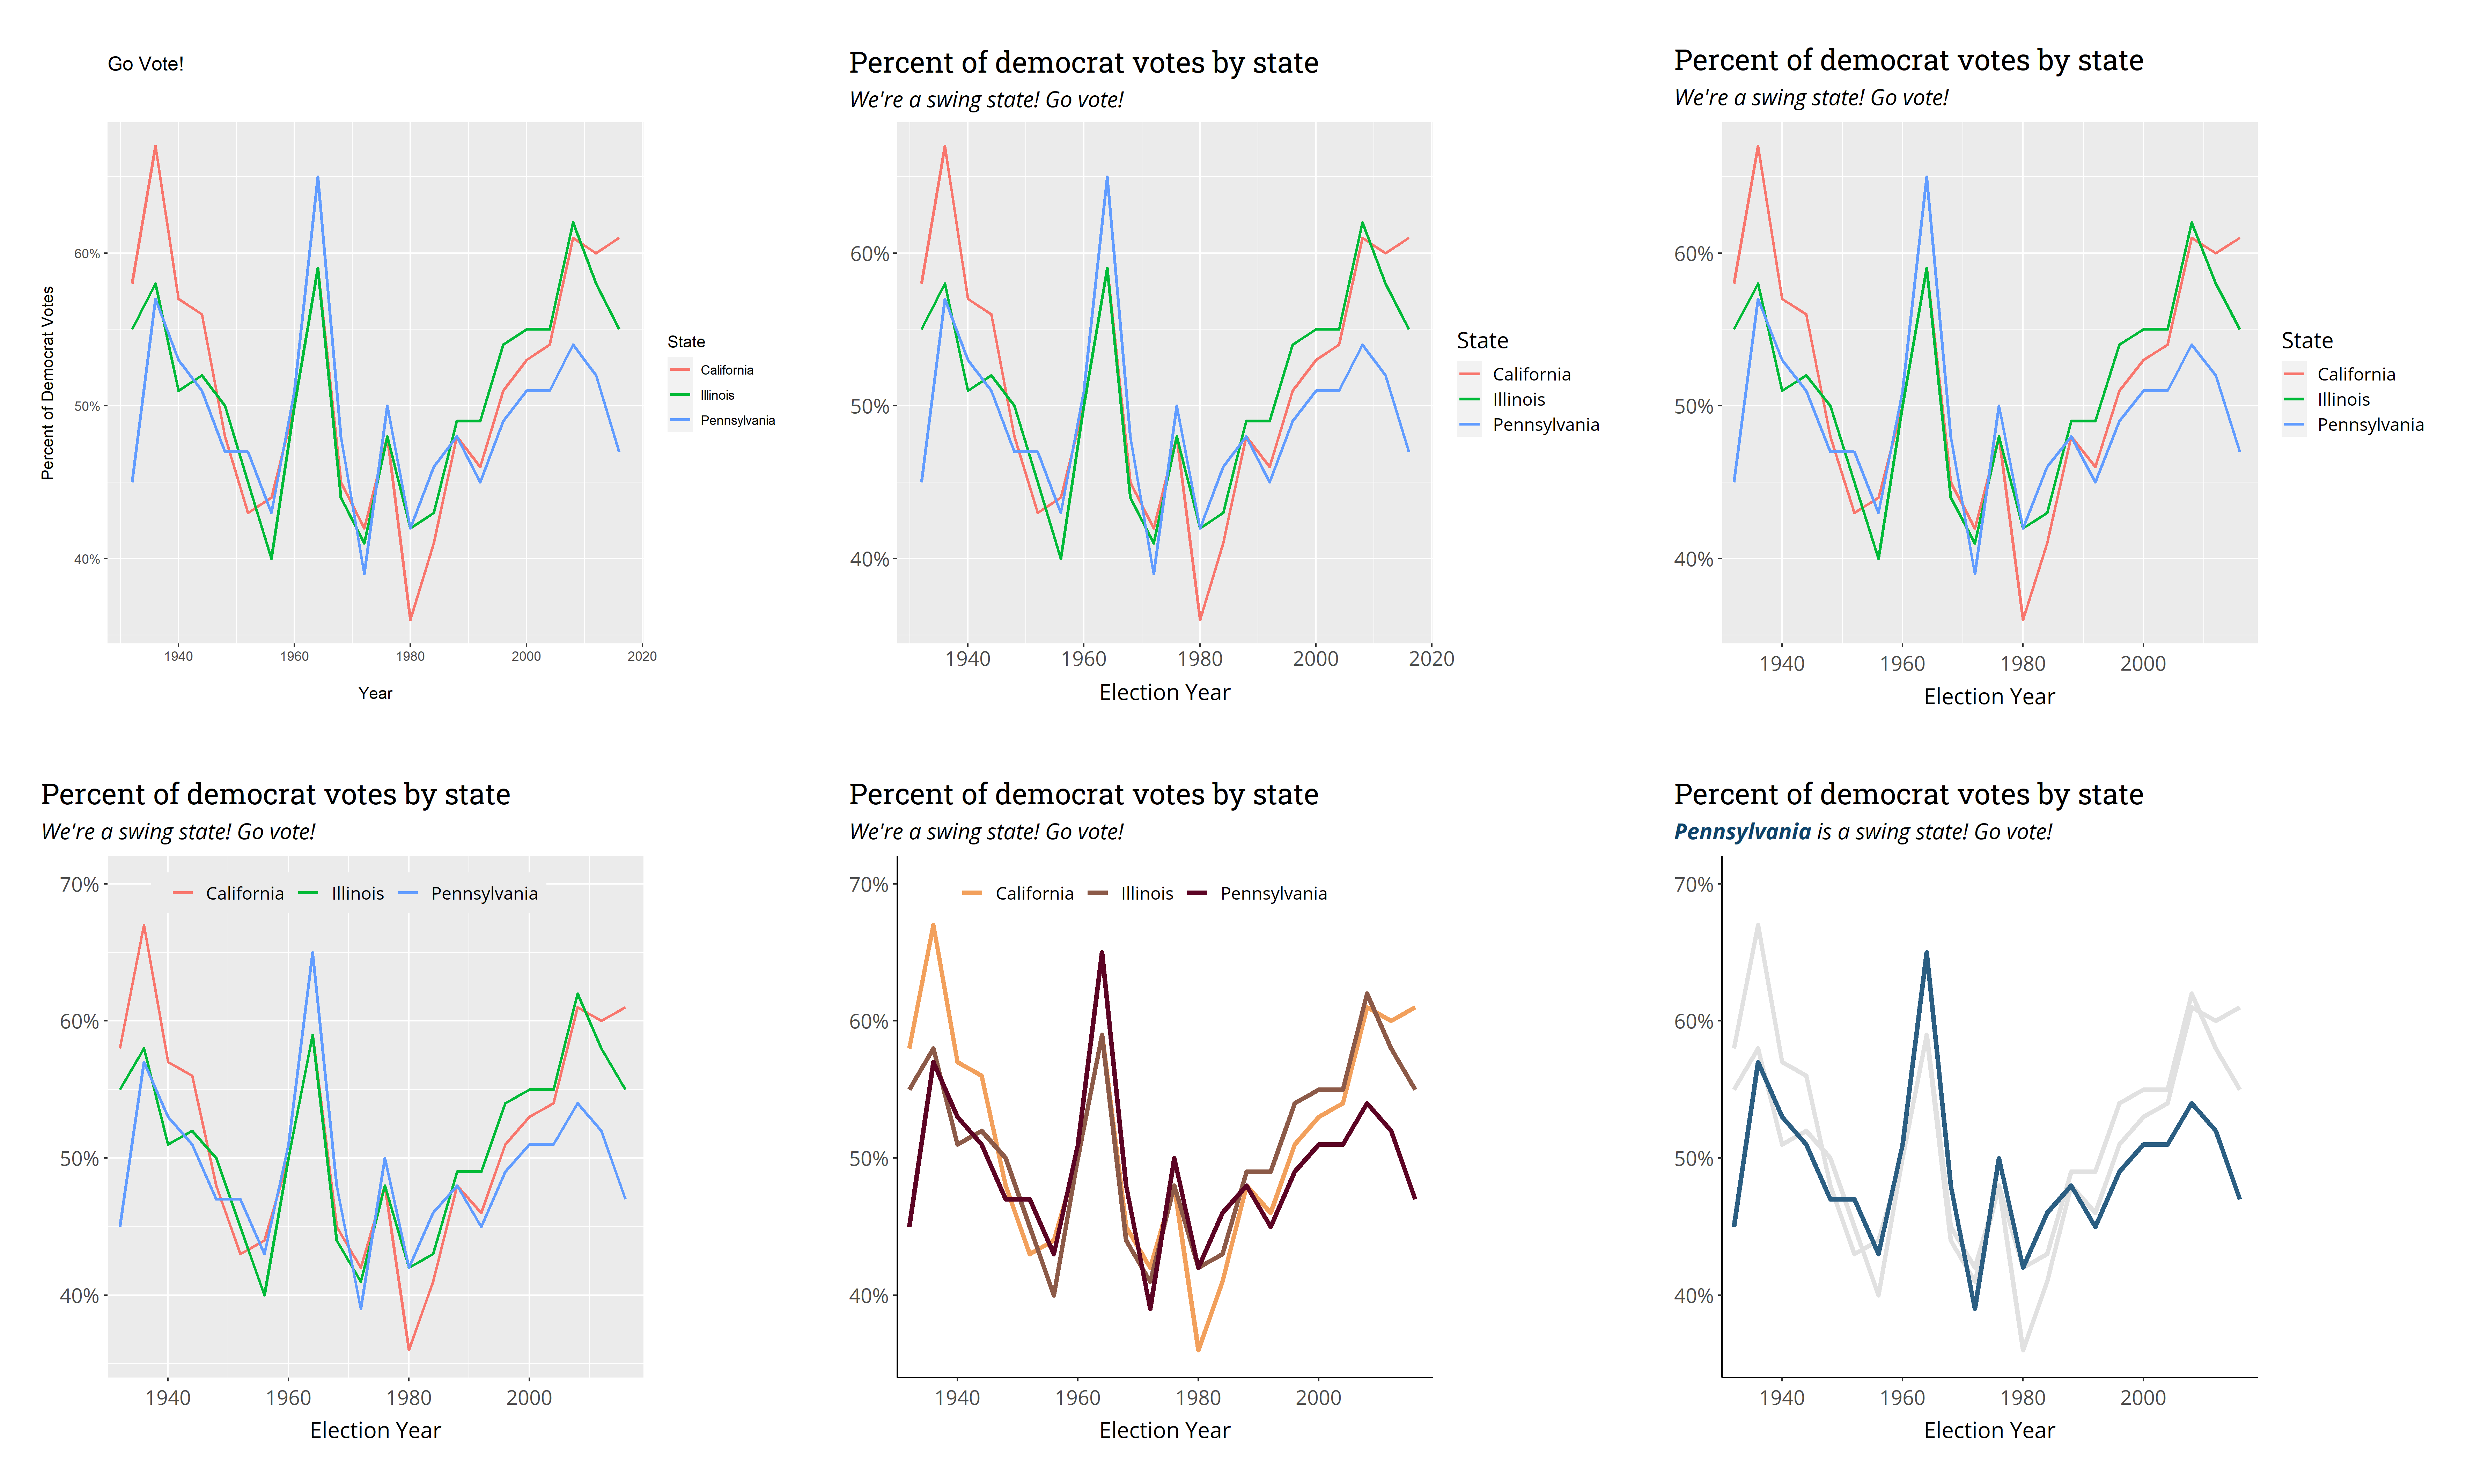
# You can also use operator symbols for layout(plot_list[[1]] + plot_list[[2]])/plot_list[[3]]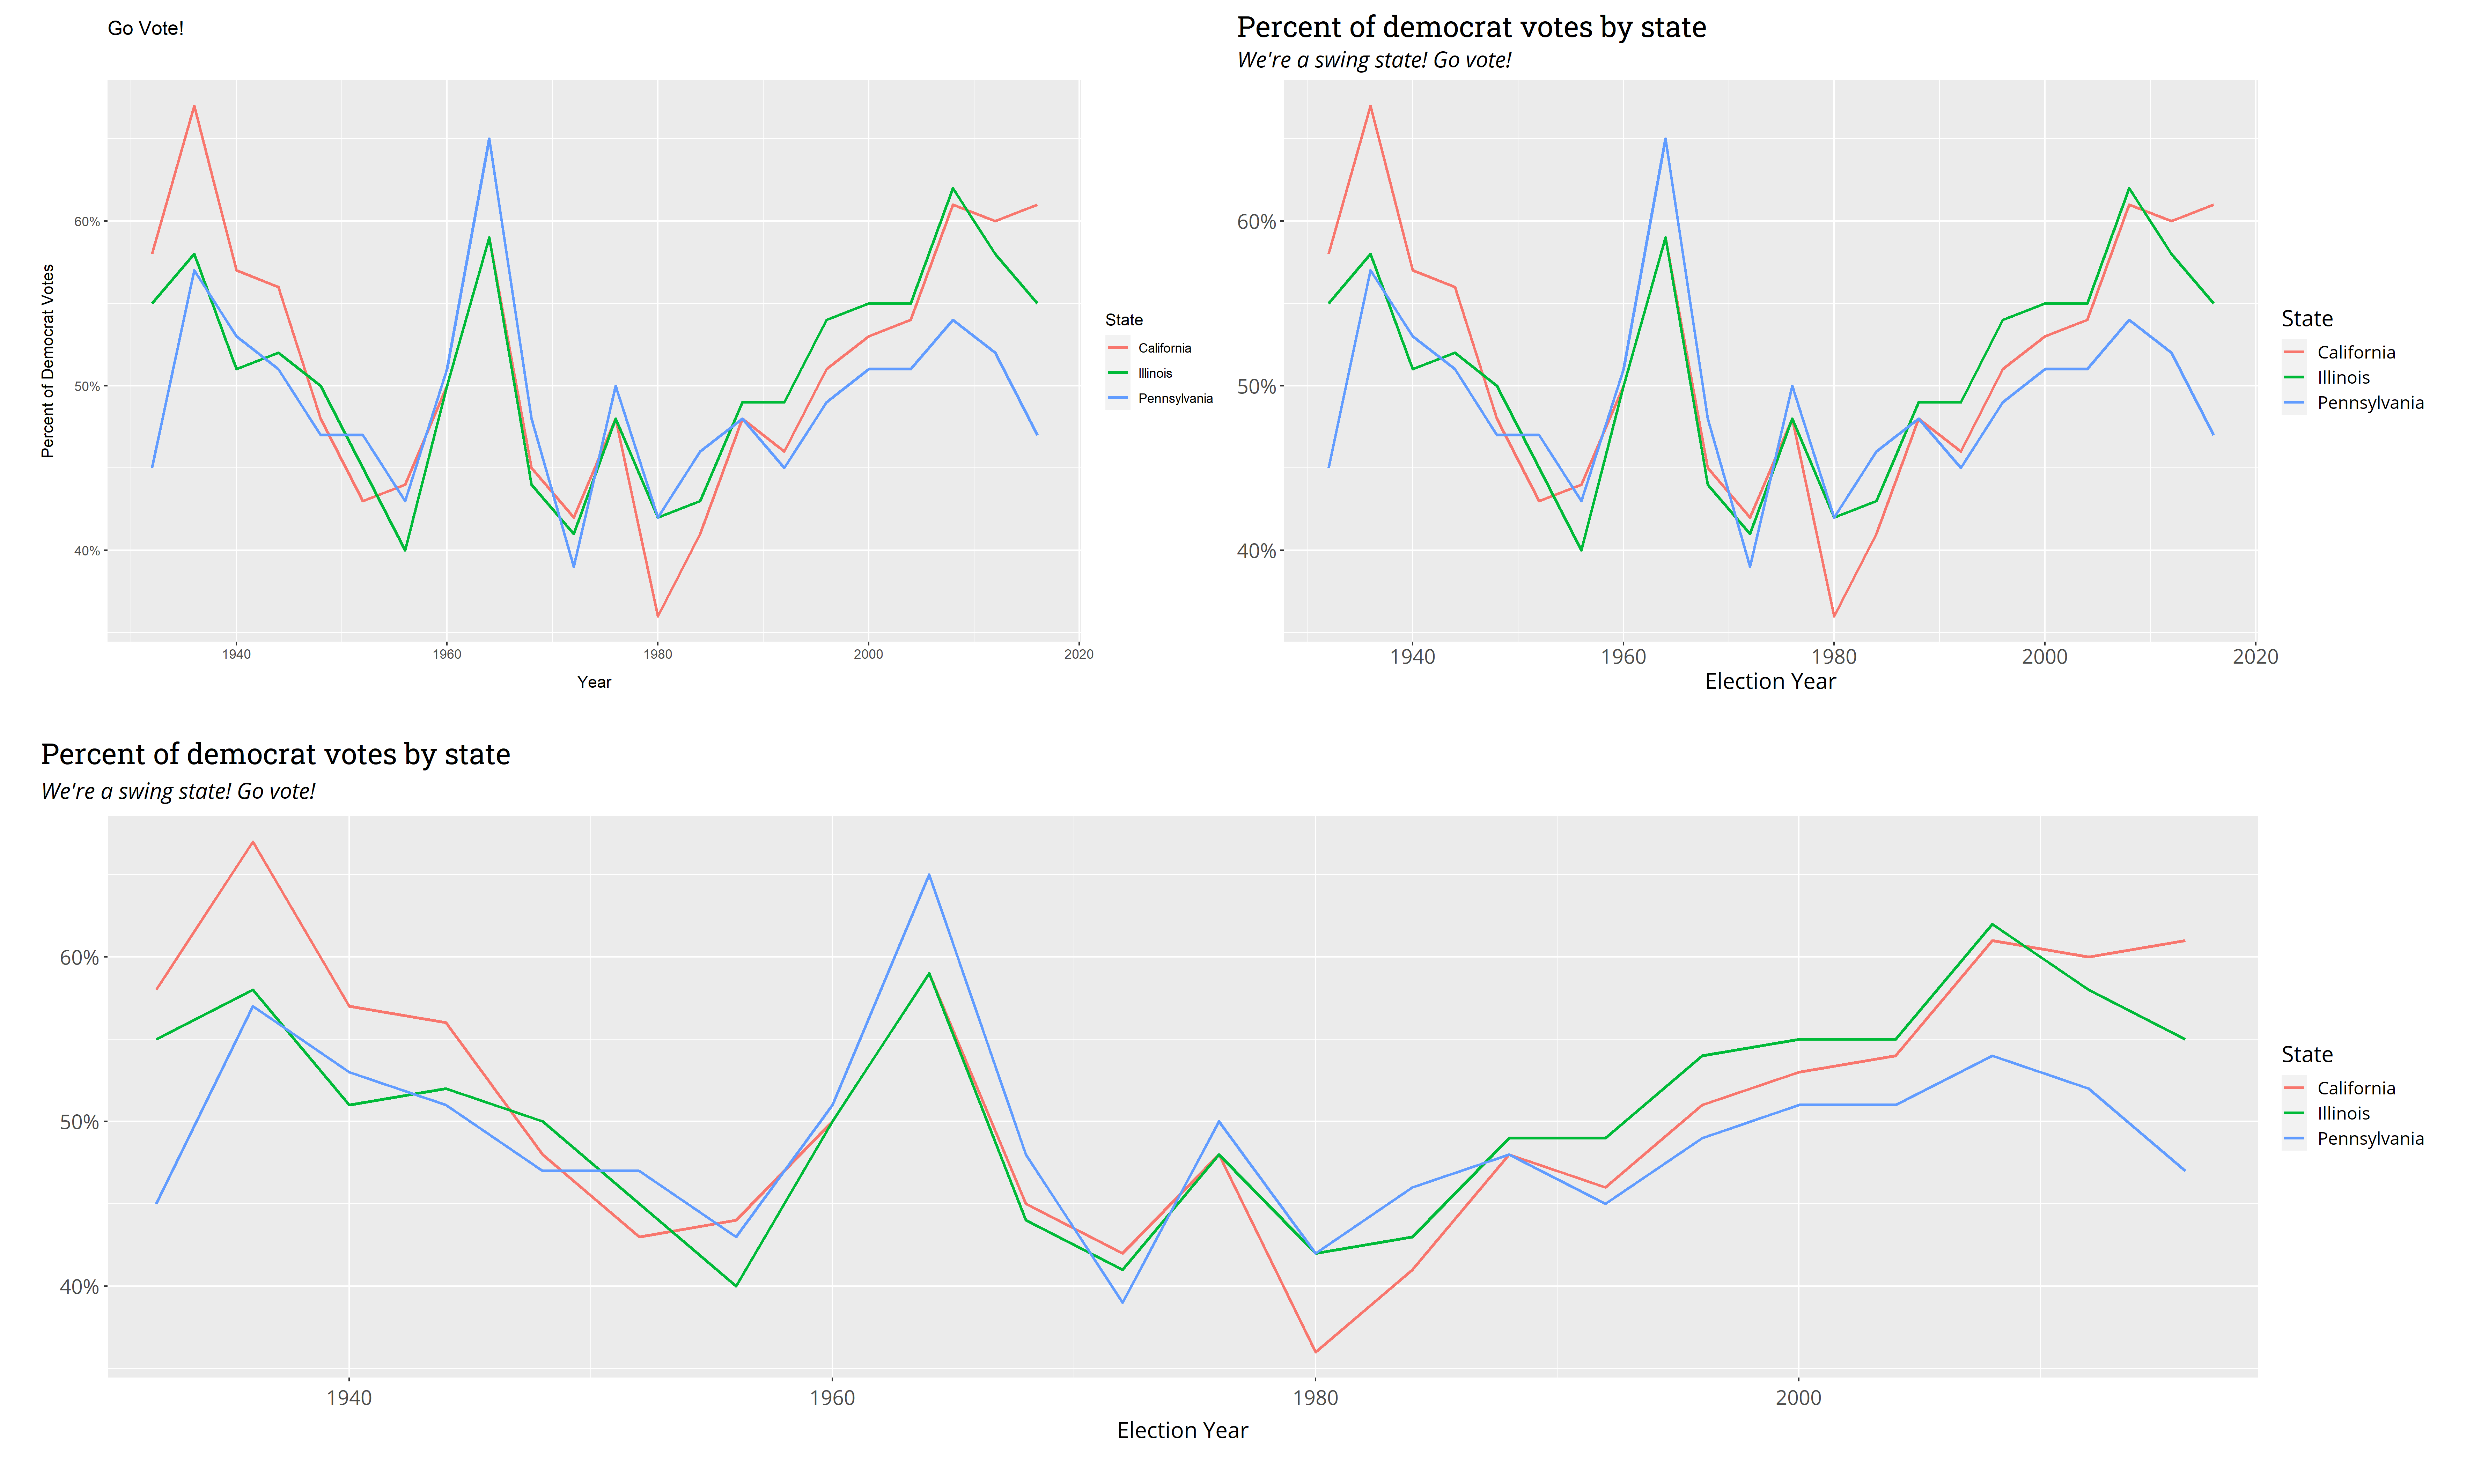
# Or set up a custom layout with a gridlayout_design <- "ABDE CCDE CCDF"wrap_plots(plot_list, design = layout_design)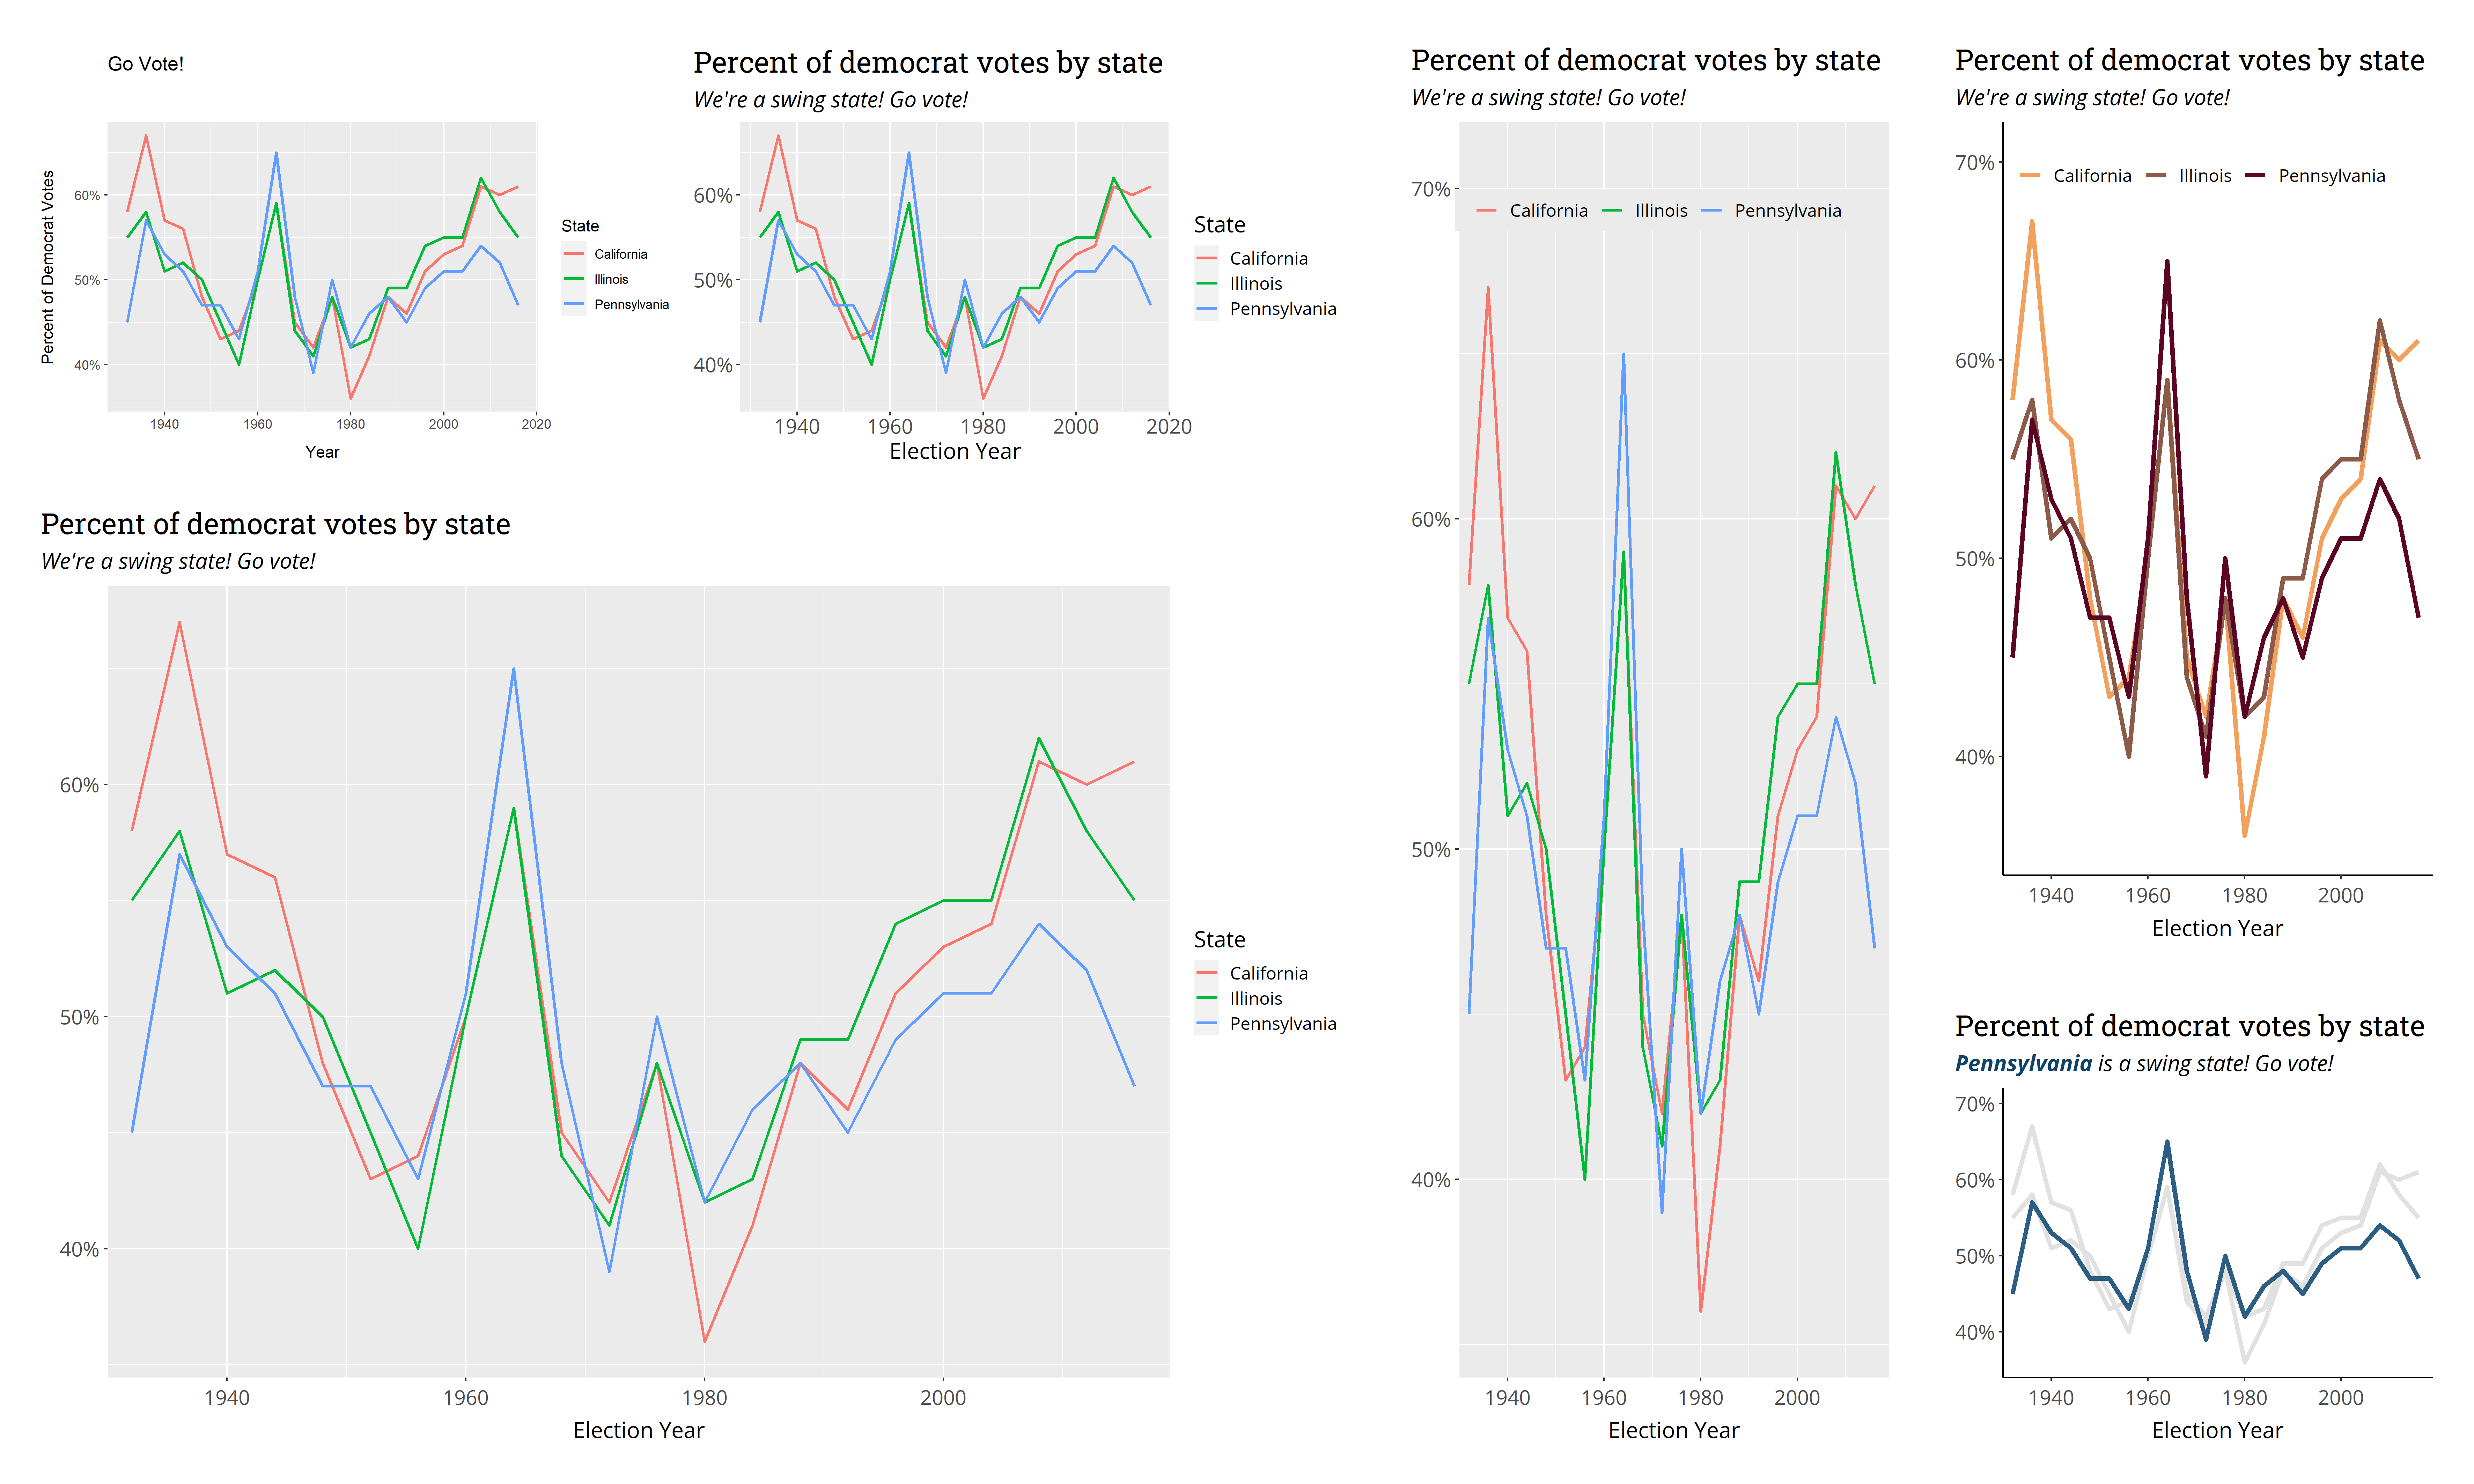
Plot
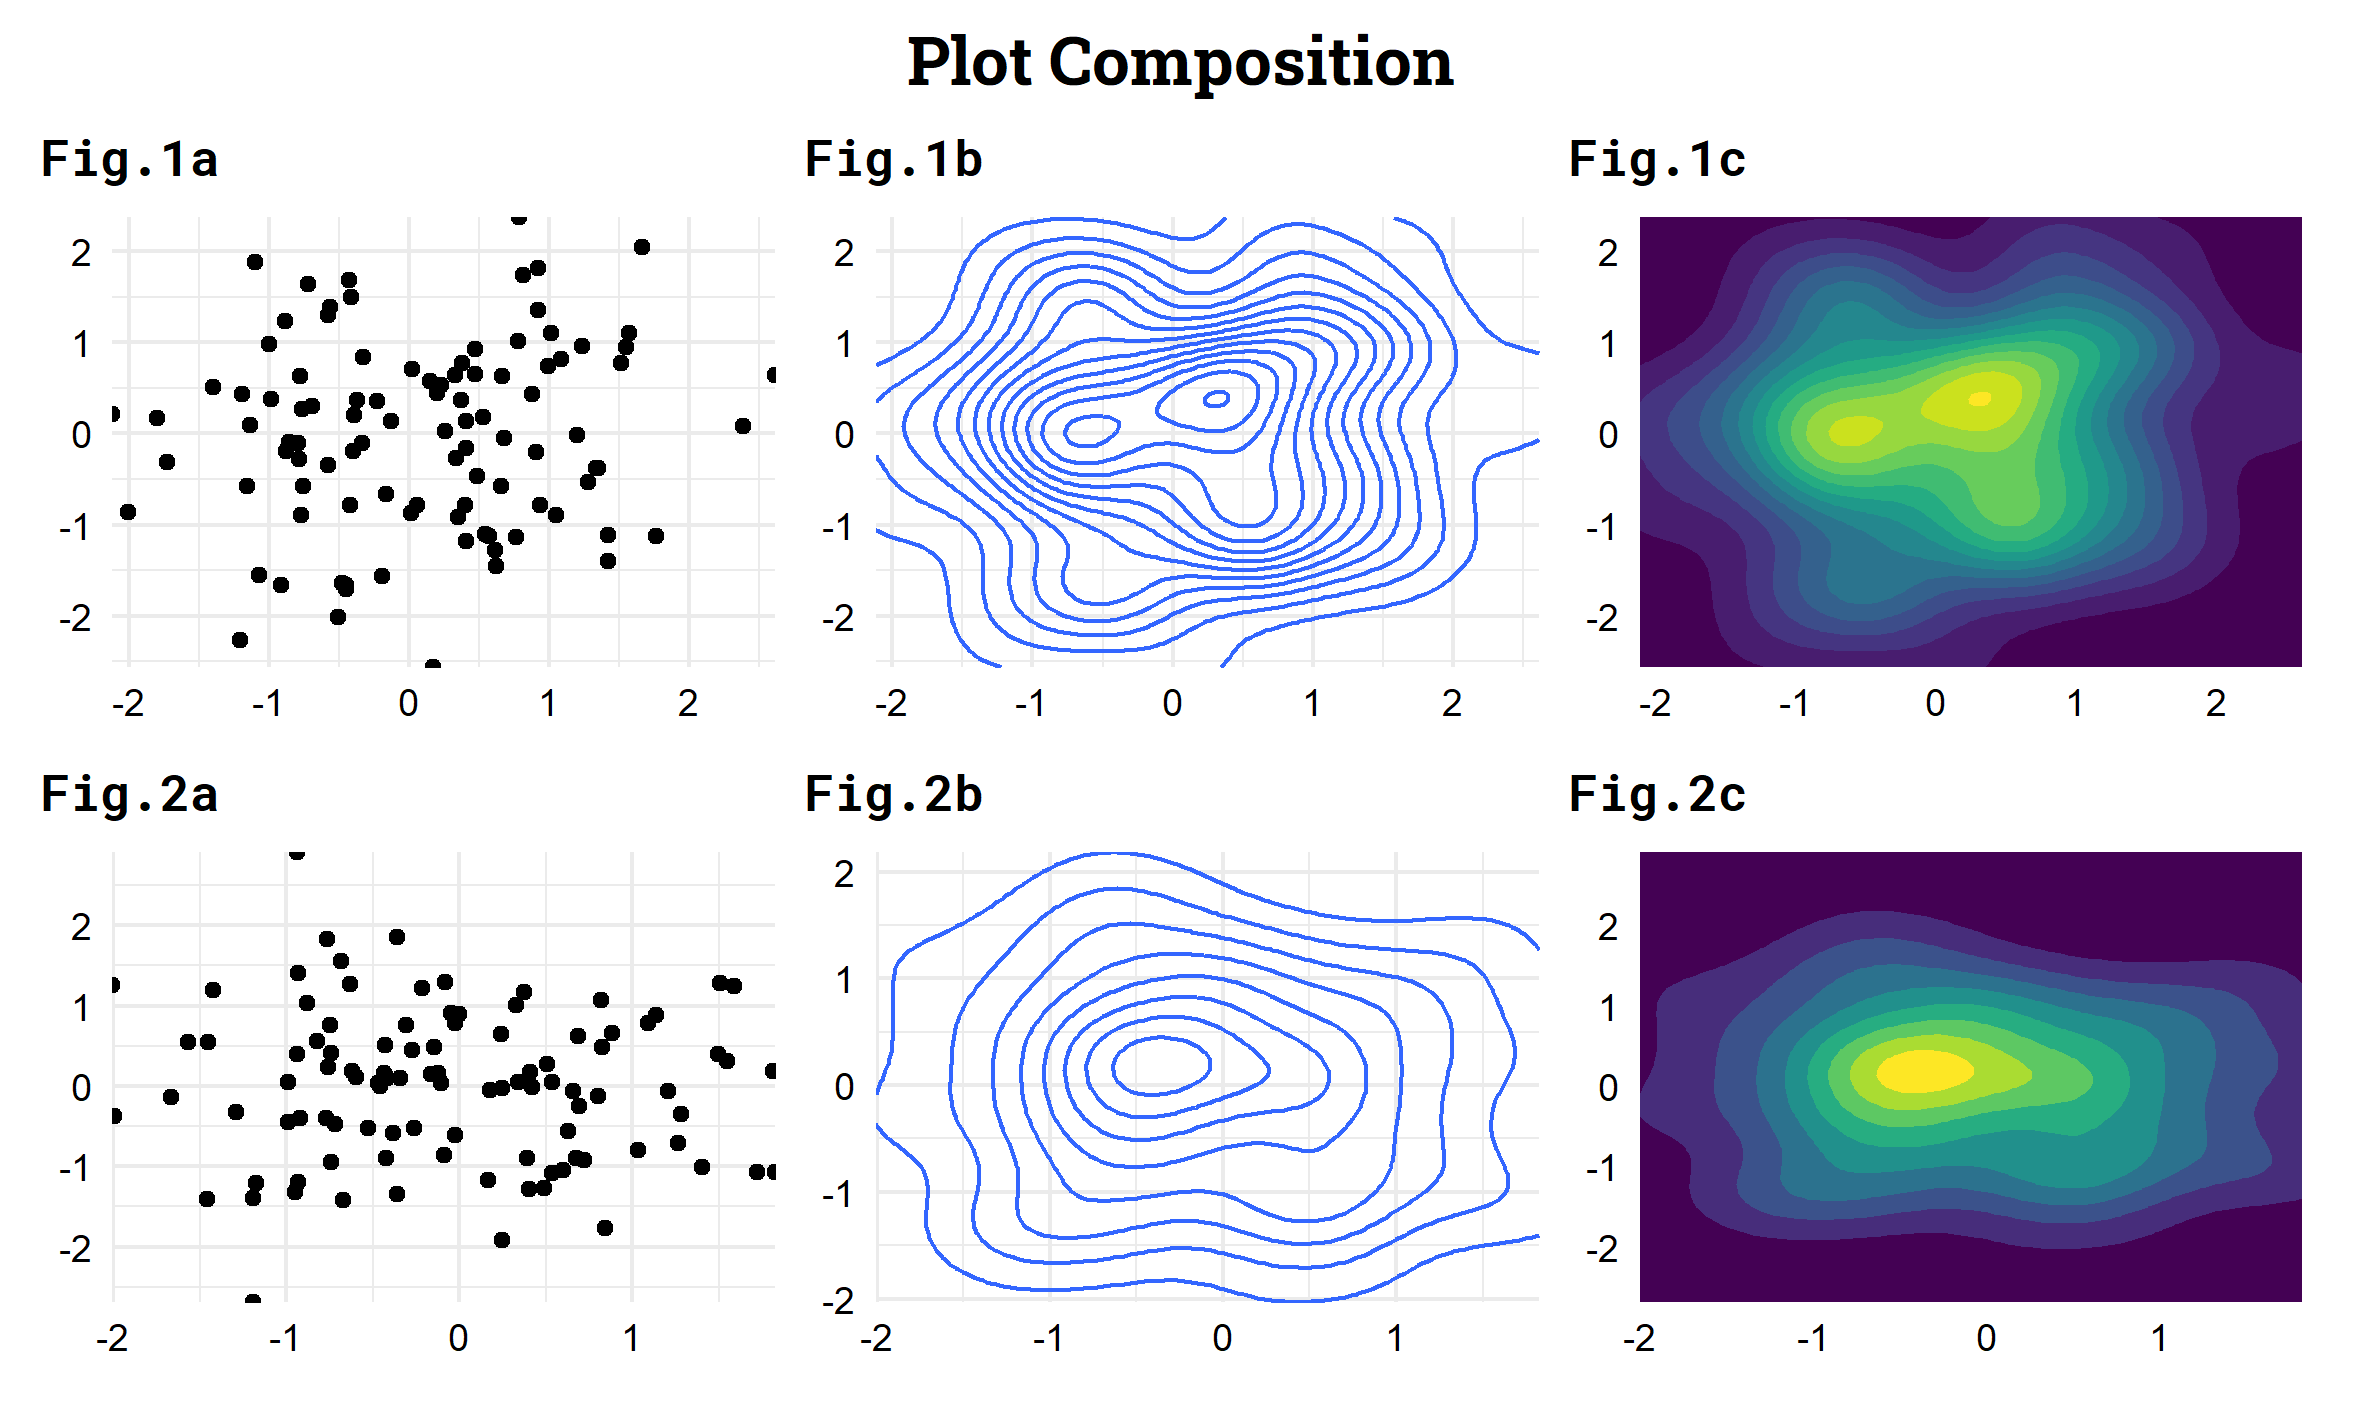
# A more complete example with themes and annotationsplotter_fun <- function(x) {map2(1:3, rep(list(list(rnorm(100), rnorm(100))), 3), ~ { ggplot(NULL, aes(x = .y[[1]], y = .y[[2]])) + list(geom_point(), geom_density2d(), geom_density_2d_filled(show.legend = FALSE))[[.x]] + labs(x = NULL, y = NULL) + coord_cartesian(expand = FALSE) + theme_minimal()})}wrap_plots(c(plotter_fun(), plotter_fun()), ncol = 3) & theme( plot.margin = margin(.9, .2, .2, .2, unit = 'cm'), plot.tag = element_text(family = "Roboto Mono", size = 12, face = 'bold'), plot.tag.position = c(.1, 1.12), axis.text = element_text(color = 'black') ) & plot_annotation( title = "Plot Composition", tag_levels = list(paste0("Fig.", rep(1:2, each = 3), letters[rep(1:3, 2)])), theme = theme( plot.title = element_text(size = 16, family = "Roboto Slab", face = 'bold', hjust = 0.5, margin = margin(b = .1, unit = 'cm')), plot.margin = margin(.3, .3, .3, .3, unit = 'cm') ) )Animations
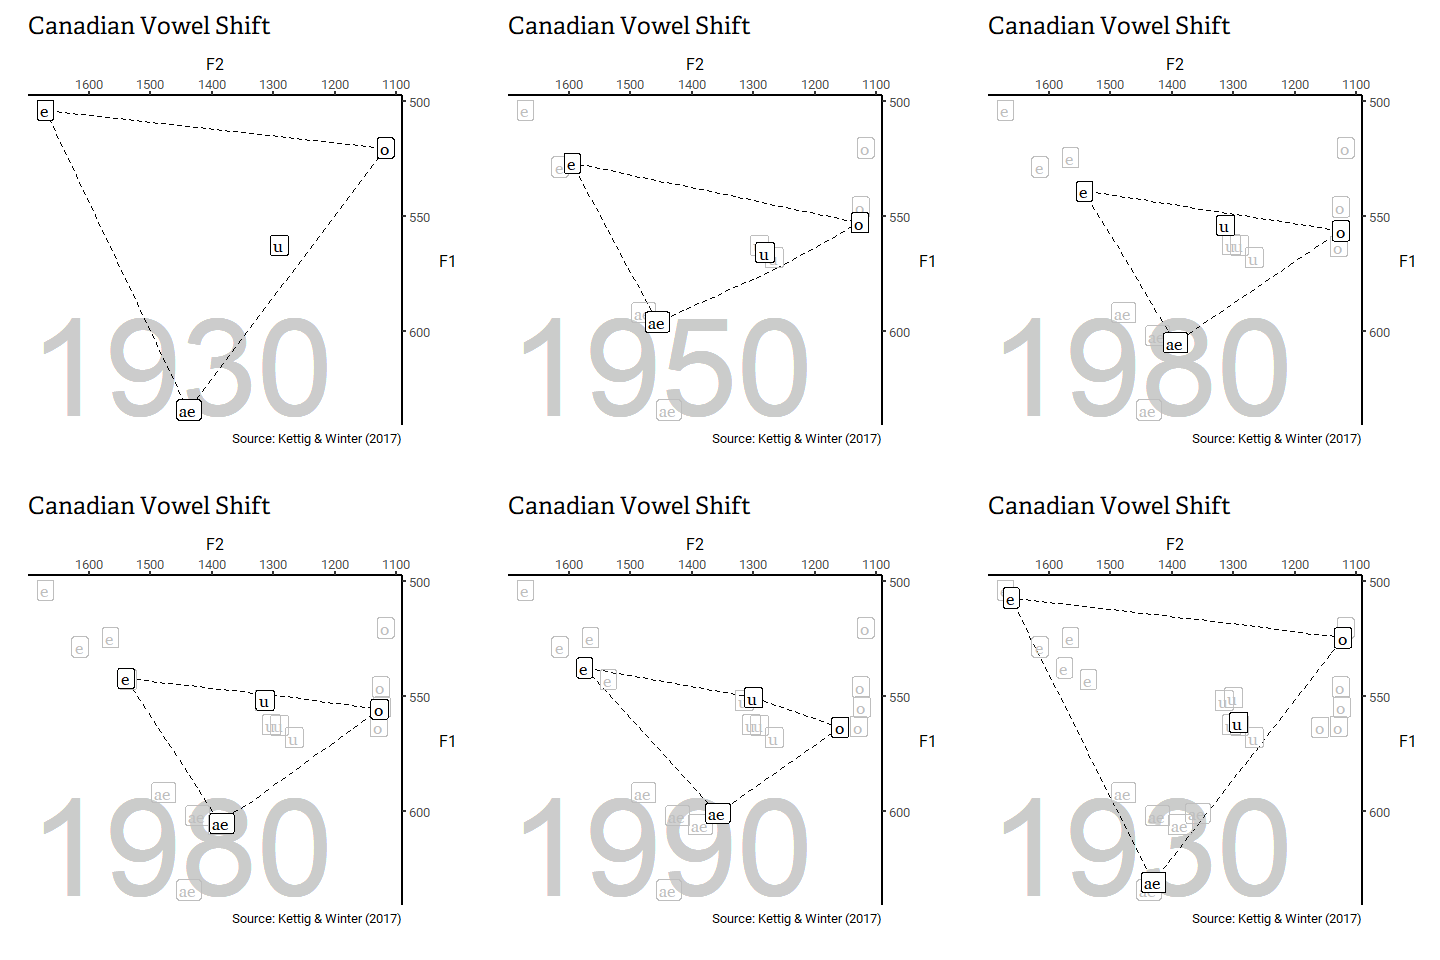
read_csv("https://raw.githubusercontent.com/bodowinter/canadian_vowel_shift_analysis/master/processed_data/production_processed.csv") %>% group_by(Gender, Vowel, BirthDecade = 10 * BirthYear %/% 10) %>% summarize(across(F1:F2, mean), .groups = 'drop') %>% filter(Gender == "F") %>% ggplot(aes(F2, F1)) + geom_text(aes(1450, 615, label = as.character(BirthDecade)), color = "gray80", size = 48) + stat_chull(fill = NA, color = "black", linetype = 2) + geom_label(aes(label = Vowel), size = 6, family = "Charis SIL") + scale_x_reverse(position = "top") + scale_y_reverse(position = "right") + theme( plot.margin = margin(.5,.8, 1.2, 1, unit = "cm"), axis.title.x.top = element_text(margin = margin(b = .2, unit = "cm")), axis.title.y.right = element_text(angle = 0, vjust = 0.5, margin = margin(l = .3, unit = "cm")) ) + coord_cartesian(clip = 'off') + labs(title = "Canadian Vowel Shift", caption = "Source: Kettig & Winter (2017)") + # animation components from {gganimate} transition_states(BirthDecade) + shadow_mark( alpha = .1, color = "grey", exclude_layer = c(1, 2) )
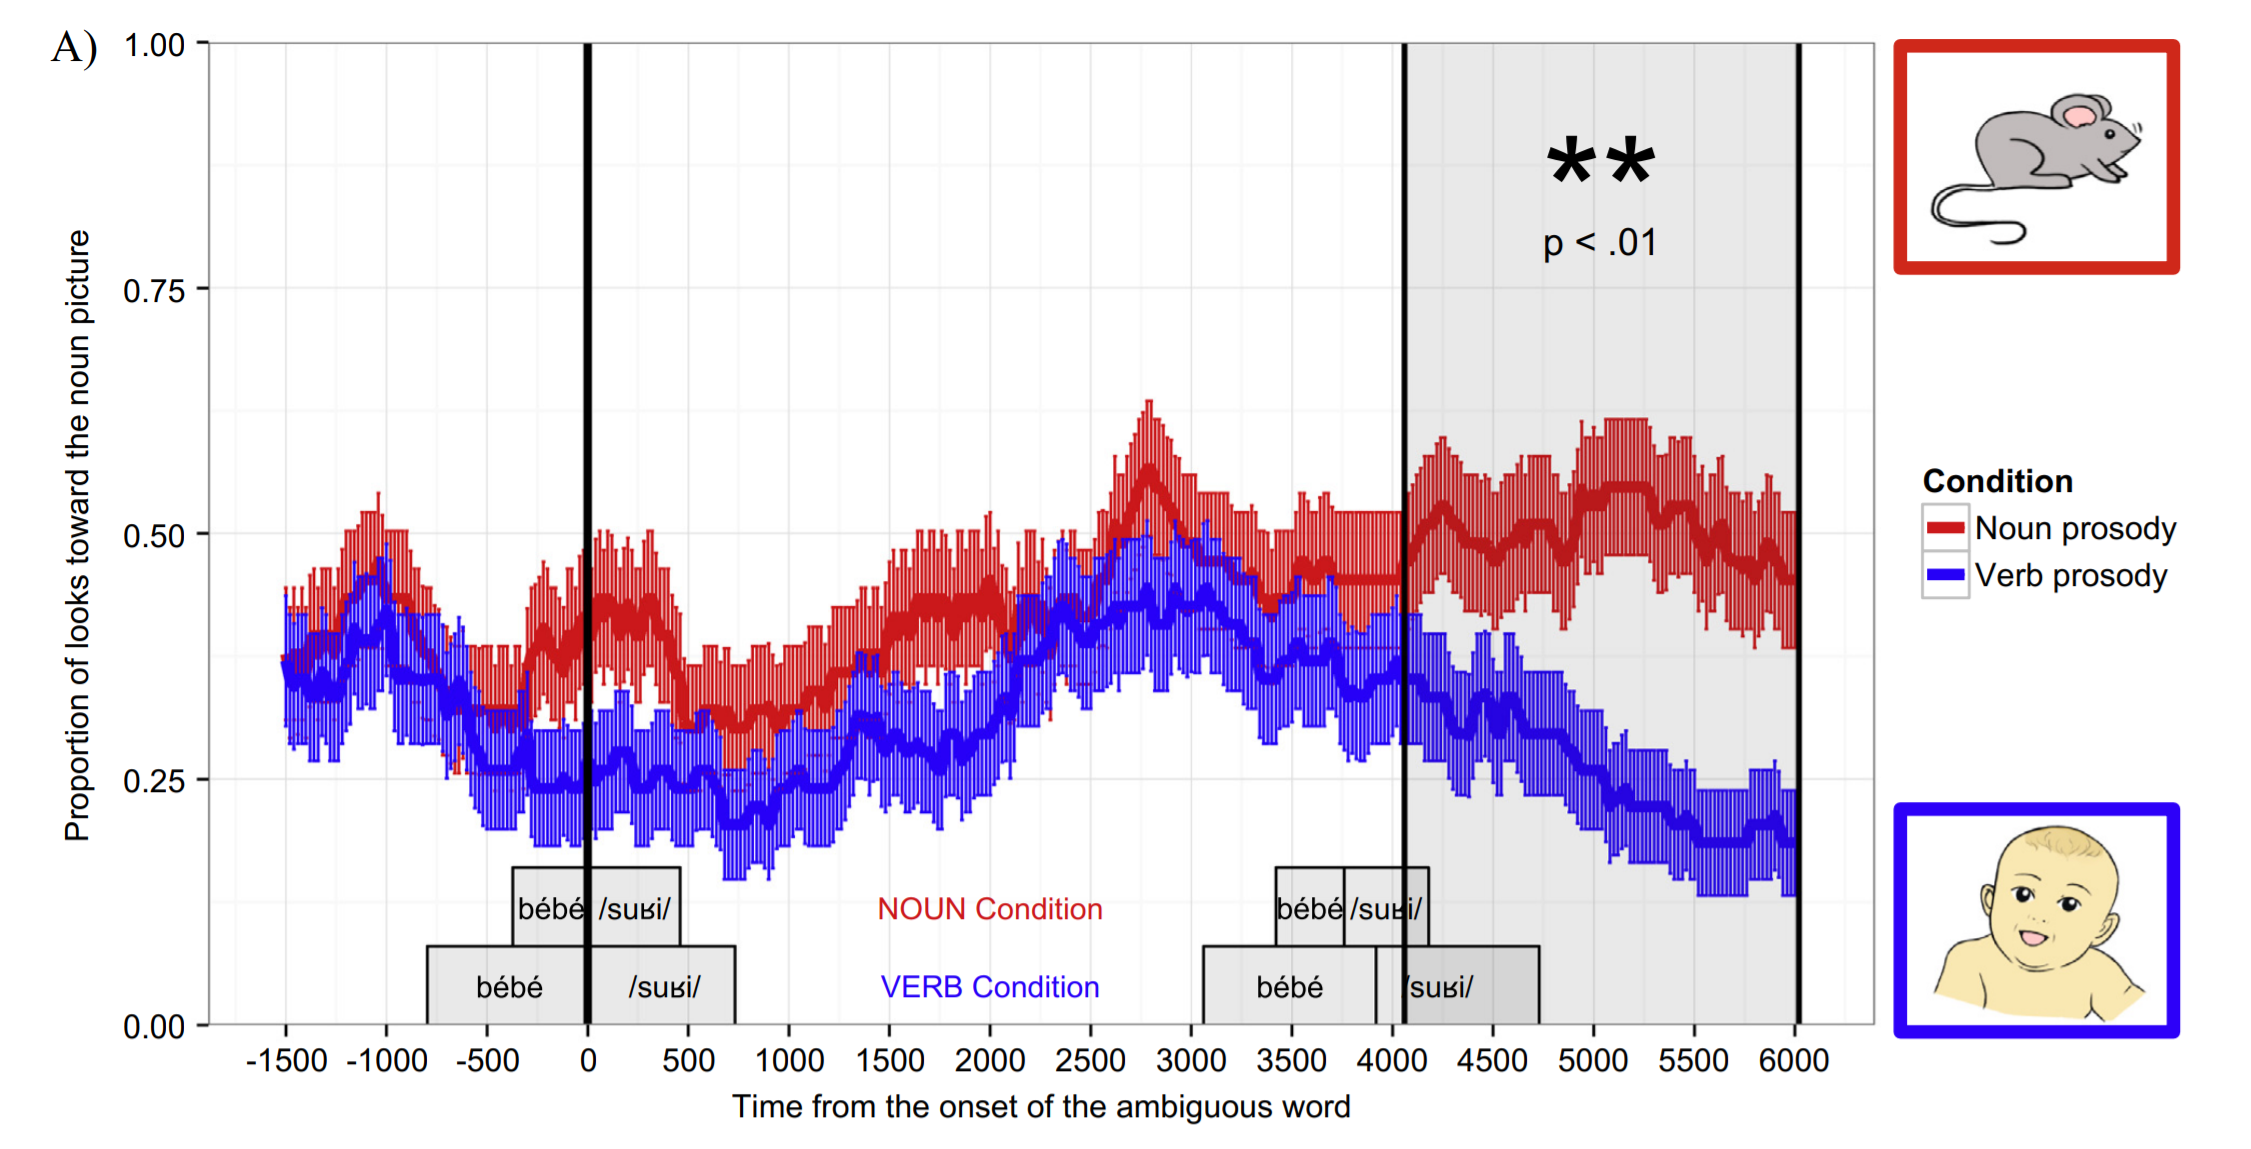
de Carvalho et al. (2017)
