class: center, middle, inverse, title-slide # Visualizing Data (in R) ## An opinionated style guide ### <br><br>June Choe<br><br>Phonetics Lab ### 2020-10-23 --- <style type="text/css"> @import url('https://fonts.googleapis.com/css?family=Roboto+Slab&display=swap'); body { font-family: Roboto Slab; } a { text-decoration: underline; color: #23395B; } .inverse { background-color: #23395B; } .remark-slide-content { # background-color: #F9F9F9; } .remark-slide-content h1 { font-size: 48; } strong, h1, h2, h3 { color: #23395B; } .sc { font-variant: small-caps; } .remark-code-line { font-size: .8em; line-height: 1.8em; } code.r.hljs.remark-code { font-size: .8em; line-height: 1.8em; position: relative; overflow-x: hidden; color: black; } code.r.hljs.remark-code:hover { overflow-x: visible; width: 700px; border-style: solid; } code.remark-inline-code { font-family: Fira Code; font-size: .8em; } .remark-slide-content{ padding-top: .5em; padding-left: 3em; } .pull-left { float: left; width: 45%; } .pull-right { float: right; width: 49%; } </style> # Why? -- **Why bother making your plots look nice?** -- - <p>Helps people <strong>remember</strong> your results better</p> -- - Makes your findings look more **credible** -- - Increases the chance of your work being **shared** -- - Shows **respect** for your audience <br> -- **Goal of this presentation** -- - <p>Share practical tips for improving readability</p> -- - Demonstrate implementations of these ideas (w/ [code](https://gist.github.com/yjunechoe/b7bc540f290044ffebec0a9031d586df)) --- # Outline -- **Four practical tips for improving data visualizations** -- - <p>Make your <strong>text</strong> readable</p> -- - Be generous about **margins and spacing** -- - Make your **legends** clear -- - Make **color** easy on your reader's eyes -- **Showcases** -- - Vowel formant plot - Vowel space plot - Bar plot of proportions - Multiple categorical levels - Animations --- # Preliminaries .pull-left[ Work with the `{ggplot2}` ecosystem in R - Widely used in academia - Easy to use and highly customizable - Tons of free resources for learning - Lots of extensions ] .pull-right[ <img src="https://d33wubrfki0l68.cloudfront.net/2c6239d311be6d037c251c71c3902792f8c4ddd2/12f67/css/images/hex/ggplot2.png" width="400px" style="display: block; margin: auto 0 auto auto;" /> ] --- # Preliminaries .pull-left[ Work with the `{ggplot2}` ecosystem in R - Widely used in academia - Easy to use and highly customizable - Tons of free resources for learning - Lots of extensions ```r library(scales) library(colorspace) library(ggtext) library(lemon) library(gganimate) # library(patchwork) # library(gghighlight) # library(ggforce) # library(ggrepel) ``` ] .pull-right[ <iframe src="https://exts.ggplot2.tidyverse.org/gallery/" height="450px" width="510px"> ] --- # How does it work? <div class="figure" style="text-align: center"> <img src="P_lab_ggplot2_files/ggplot_layers.png" alt="Source: https://www.youtube.com/watch?v=h29g21z0a68" width="450px" /> <p class="caption">Source: https://www.youtube.com/watch?v=h29g21z0a68</p> </div> --- count: false .panel1-example-1-auto[ ```r *state_election_votes ``` ] .panel2-example-1-auto[ ``` # A tibble: 1,097 x 3 State demVote Year <chr> <dbl> <dbl> 1 Alabama 0.85 1932 2 Arizona 0.67 1932 3 Arkansas 0.86 1932 4 California 0.580 1932 5 Colorado 0.55 1932 6 Connecticut 0.47 1932 7 Delaware 0.48 1932 8 Florida 0.74 1932 9 Georgia 0.92 1932 10 Idaho 0.59 1932 # ... with 1,087 more rows ``` ] --- count: false .panel1-example-1-auto[ ```r state_election_votes %>% * filter(State %in% * c("Pennsylvania", * "Illinois", * "California") * ) ``` ] .panel2-example-1-auto[ ``` # A tibble: 66 x 3 State demVote Year <chr> <dbl> <dbl> 1 California 0.580 1932 2 Illinois 0.55 1932 3 Pennsylvania 0.45 1932 4 California 0.67 1936 5 Illinois 0.580 1936 6 Pennsylvania 0.570 1936 7 California 0.570 1940 8 Illinois 0.51 1940 9 Pennsylvania 0.53 1940 10 California 0.56 1944 # ... with 56 more rows ``` ] --- count: false .panel1-example-1-auto[ ```r state_election_votes %>% filter(State %in% c("Pennsylvania", "Illinois", "California") ) %>% * ggplot() ``` ] .panel2-example-1-auto[ <!-- --> ] --- count: false .panel1-example-1-auto[ ```r state_election_votes %>% filter(State %in% c("Pennsylvania", "Illinois", "California") ) %>% ggplot() + * aes( * x = Year, * y = demVote, * color = State * ) ``` ] .panel2-example-1-auto[ <!-- --> ] --- count: false .panel1-example-1-auto[ ```r state_election_votes %>% filter(State %in% c("Pennsylvania", "Illinois", "California") ) %>% ggplot() + aes( x = Year, y = demVote, color = State ) + * geom_point() ``` ] .panel2-example-1-auto[ <!-- --> ] --- count: false .panel1-example-1-auto[ ```r state_election_votes %>% filter(State %in% c("Pennsylvania", "Illinois", "California") ) %>% ggplot() + aes( x = Year, y = demVote, color = State ) + geom_point() + * scale_y_continuous( * labels = percent_format(accuracy = 1) * ) ``` ] .panel2-example-1-auto[ <!-- --> ] --- count: false .panel1-example-1-auto[ ```r state_election_votes %>% filter(State %in% c("Pennsylvania", "Illinois", "California") ) %>% ggplot() + aes( x = Year, y = demVote, color = State ) + geom_point() + scale_y_continuous( labels = percent_format(accuracy = 1) ) + * scale_x_continuous( * breaks = pretty_breaks(n= 5) * ) ``` ] .panel2-example-1-auto[ <!-- --> ] --- count: false .panel1-example-1-auto[ ```r state_election_votes %>% filter(State %in% c("Pennsylvania", "Illinois", "California") ) %>% ggplot() + aes( x = Year, y = demVote, color = State ) + geom_point() + scale_y_continuous( labels = percent_format(accuracy = 1) ) + scale_x_continuous( breaks = pretty_breaks(n= 5) ) + * labs( * y = "Democrat Votes", * title = "Go Vote!" * ) ``` ] .panel2-example-1-auto[ <!-- --> ] --- count: false .panel1-example-1-auto[ ```r state_election_votes %>% filter(State %in% c("Pennsylvania", "Illinois", "California") ) %>% ggplot() + aes( x = Year, y = demVote, color = State ) + geom_point() + scale_y_continuous( labels = percent_format(accuracy = 1) ) + scale_x_continuous( breaks = pretty_breaks(n= 5) ) + labs( y = "Democrat Votes", title = "Go Vote!" ) ``` ] .panel2-example-1-auto[ <!-- --> ] <style> .panel1-example-1-auto { color: black; width: 39.2%; hight: 32%; float: left; padding-left: 1%; font-size: 80% } .panel2-example-1-auto { color: black; width: 58.8%; hight: 32%; float: left; padding-left: 1%; font-size: 80% } .panel3-example-1-auto { color: black; width: NA%; hight: 33%; float: left; padding-left: 1%; font-size: 80% } </style> --- count: false .panel1-example-1-rotate[ ```r state_election_votes %>% filter(State %in% c("Pennsylvania", "Illinois", "California") ) %>% ggplot() + aes( x = Year, y = demVote, color = State ) + * geom_point() + scale_y_continuous( labels = percent_format(accuracy = 1) ) + scale_x_continuous( breaks = pretty_breaks(n= 5) ) + labs( y = "Democrat Votes", title = "Go Vote!" ) ``` ] .panel2-example-1-rotate[ <!-- --> ] --- count: false .panel1-example-1-rotate[ ```r state_election_votes %>% filter(State %in% c("Pennsylvania", "Illinois", "California") ) %>% ggplot() + aes( x = Year, y = demVote, color = State ) + * geom_line() + scale_y_continuous( labels = percent_format(accuracy = 1) ) + scale_x_continuous( breaks = pretty_breaks(n= 5) ) + labs( y = "Democrat Votes", title = "Go Vote!" ) ``` ] .panel2-example-1-rotate[ <!-- --> ] --- count: false .panel1-example-1-rotate[ ```r state_election_votes %>% filter(State %in% c("Pennsylvania", "Illinois", "California") ) %>% ggplot() + aes( x = Year, y = demVote, color = State ) + * geom_line(size = 1) + scale_y_continuous( labels = percent_format(accuracy = 1) ) + scale_x_continuous( breaks = pretty_breaks(n= 5) ) + labs( y = "Democrat Votes", title = "Go Vote!" ) ``` ] .panel2-example-1-rotate[ <!-- --> ] <style> .panel1-example-1-rotate { color: black; width: 39.2%; hight: 32%; float: left; padding-left: 1%; font-size: 80% } .panel2-example-1-rotate { color: black; width: 58.8%; hight: 32%; float: left; padding-left: 1%; font-size: 80% } .panel3-example-1-rotate { color: black; width: NA%; hight: 33%; float: left; padding-left: 1%; font-size: 80% } </style> --- # Yay a plot! .pull-left[ <img src="P_lab_ggplot2_files/figure-html/state_election_plot-1.png" height="450px" style="display: block; margin: auto;" /> ] .pull-right[ ] --- # Yay a plot... ? .pull-left[ <img src="P_lab_ggplot2_files/figure-html/state_election_plot-1.png" height="450px" style="display: block; margin: auto;" /> ] .pull-right[ **A few problems** - Text is small and narrow - Plot elements are squished together - Color doesn't grab attention - Legend is off to the side on its own ] --- #1. Text Many different ways to style text: -- - <p><span style="font-size: .7em">font</span> <span style="font-size: 1.5em">size</span></p> -- - Font face (<strong style="color:black">bold</strong>, *italic*, <span style="font-variant: small-caps">small caps</span>) -- - Font family (<span style="font-family: Times New Roman"> Times New Roman</span>, <span style="font-family: Calibri"> Calibri</span>, <span style="font-family: Arial"> Arial</span>, <span style="font-family: Wingdings">Hi friends</span> ) -- - Font color, line height, letter spacing, angle, weight, etc. -- <br> Unless you make your plots with html/css/js, you'll likely only have access to: -- - <p>Font size, font family, and limited set of font styles</p> -- - But you can get pretty far with these! --- count: false .panel1-text-auto[ ```r *state_election_plot ``` ] .panel2-text-auto[ <!-- --> ] --- count: false .panel1-text-auto[ ```r state_election_plot + * theme(text = element_text(family = "Roboto")) ``` ] .panel2-text-auto[ <!-- --> ] --- count: false .panel1-text-auto[ ```r state_election_plot + theme(text = element_text(family = "Roboto")) + * theme(text = element_text(size = 15)) ``` ] .panel2-text-auto[ <!-- --> ] --- count: false .panel1-text-auto[ ```r state_election_plot + theme(text = element_text(family = "Roboto")) + theme(text = element_text(size = 15)) + * theme(plot.title = element_text(size = 20)) ``` ] .panel2-text-auto[ <!-- --> ] --- count: false .panel1-text-auto[ ```r state_election_plot + theme(text = element_text(family = "Roboto")) + theme(text = element_text(size = 15)) + theme(plot.title = element_text(size = 20)) + * theme(plot.title = element_text(family = "Roboto Slab")) ``` ] .panel2-text-auto[ <!-- --> ] --- count: false .panel1-text-auto[ ```r state_election_plot + theme(text = element_text(family = "Roboto")) + theme(text = element_text(size = 15)) + theme(plot.title = element_text(size = 20)) + theme(plot.title = element_text(family = "Roboto Slab")) + * theme(plot.title.position = "plot") ``` ] .panel2-text-auto[ <!-- --> ] --- count: false .panel1-text-auto[ ```r state_election_plot + theme(text = element_text(family = "Roboto")) + theme(text = element_text(size = 15)) + theme(plot.title = element_text(size = 20)) + theme(plot.title = element_text(family = "Roboto Slab")) + theme(plot.title.position = "plot") + * labs(x = "Election Year") ``` ] .panel2-text-auto[ <!-- --> ] --- count: false .panel1-text-auto[ ```r state_election_plot + theme(text = element_text(family = "Roboto")) + theme(text = element_text(size = 15)) + theme(plot.title = element_text(size = 20)) + theme(plot.title = element_text(family = "Roboto Slab")) + theme(plot.title.position = "plot") + labs(x = "Election Year") + * labs(y = NULL) ``` ] .panel2-text-auto[ <!-- --> ] --- count: false .panel1-text-auto[ ```r state_election_plot + theme(text = element_text(family = "Roboto")) + theme(text = element_text(size = 15)) + theme(plot.title = element_text(size = 20)) + theme(plot.title = element_text(family = "Roboto Slab")) + theme(plot.title.position = "plot") + labs(x = "Election Year") + labs(y = NULL) + * labs(title = "Percent of democrat votes by state") ``` ] .panel2-text-auto[ <!-- --> ] --- count: false .panel1-text-auto[ ```r state_election_plot + theme(text = element_text(family = "Roboto")) + theme(text = element_text(size = 15)) + theme(plot.title = element_text(size = 20)) + theme(plot.title = element_text(family = "Roboto Slab")) + theme(plot.title.position = "plot") + labs(x = "Election Year") + labs(y = NULL) + labs(title = "Percent of democrat votes by state") + * labs(subtitle = "We're a swing state! Go vote!") ``` ] .panel2-text-auto[ <!-- --> ] --- count: false .panel1-text-auto[ ```r state_election_plot + theme(text = element_text(family = "Roboto")) + theme(text = element_text(size = 15)) + theme(plot.title = element_text(size = 20)) + theme(plot.title = element_text(family = "Roboto Slab")) + theme(plot.title.position = "plot") + labs(x = "Election Year") + labs(y = NULL) + labs(title = "Percent of democrat votes by state") + labs(subtitle = "We're a swing state! Go vote!") + * theme(plot.subtitle = element_text(face = "italic")) ``` ] .panel2-text-auto[ <!-- --> ] <style> .panel1-text-auto { color: black; width: 39.2%; hight: 32%; float: left; padding-left: 1%; font-size: 80% } .panel2-text-auto { color: black; width: 58.8%; hight: 32%; float: left; padding-left: 1%; font-size: 80% } .panel3-text-auto { color: black; width: NA%; hight: 33%; float: left; padding-left: 1%; font-size: 80% } </style> --- count: false .panel1-text-rotate[ ```r state_election_plot + * theme(text = element_text(family = "Adelle")) + theme(text = element_text(size = 15)) + theme(plot.title = element_text(size = 20)) + theme(plot.title = element_text(family = "Roboto Slab")) + theme(plot.title.position = "plot") + labs(x = "Election Year") + labs(y = NULL) + labs(title = "Percent of democrat votes by state") + labs(subtitle = "We're a swing state! Go vote!") + theme(plot.subtitle = element_text(face = "italic")) ``` ] .panel2-text-rotate[ <!-- --> ] --- count: false .panel1-text-rotate[ ```r state_election_plot + * theme(text = element_text(family = "Bitter")) + theme(text = element_text(size = 15)) + theme(plot.title = element_text(size = 20)) + theme(plot.title = element_text(family = "Roboto Slab")) + theme(plot.title.position = "plot") + labs(x = "Election Year") + labs(y = NULL) + labs(title = "Percent of democrat votes by state") + labs(subtitle = "We're a swing state! Go vote!") + theme(plot.subtitle = element_text(face = "italic")) ``` ] .panel2-text-rotate[ <!-- --> ] --- count: false .panel1-text-rotate[ ```r state_election_plot + * theme(text = element_text(family = "Futura Bk BT")) + theme(text = element_text(size = 15)) + theme(plot.title = element_text(size = 20)) + theme(plot.title = element_text(family = "Roboto Slab")) + theme(plot.title.position = "plot") + labs(x = "Election Year") + labs(y = NULL) + labs(title = "Percent of democrat votes by state") + labs(subtitle = "We're a swing state! Go vote!") + theme(plot.subtitle = element_text(face = "italic")) ``` ] .panel2-text-rotate[ <!-- --> ] --- count: false .panel1-text-rotate[ ```r state_election_plot + * theme(text = element_text(family = "Montserrat")) + theme(text = element_text(size = 15)) + theme(plot.title = element_text(size = 20)) + theme(plot.title = element_text(family = "Roboto Slab")) + theme(plot.title.position = "plot") + labs(x = "Election Year") + labs(y = NULL) + labs(title = "Percent of democrat votes by state") + labs(subtitle = "We're a swing state! Go vote!") + theme(plot.subtitle = element_text(face = "italic")) ``` ] .panel2-text-rotate[ <!-- --> ] --- count: false .panel1-text-rotate[ ```r state_election_plot + * theme(text = element_text(family = "Montserrat Medium")) + theme(text = element_text(size = 15)) + theme(plot.title = element_text(size = 20)) + theme(plot.title = element_text(family = "Roboto Slab")) + theme(plot.title.position = "plot") + labs(x = "Election Year") + labs(y = NULL) + labs(title = "Percent of democrat votes by state") + labs(subtitle = "We're a swing state! Go vote!") + theme(plot.subtitle = element_text(face = "italic")) ``` ] .panel2-text-rotate[ <!-- --> ] --- count: false .panel1-text-rotate[ ```r state_election_plot + * theme(text = element_text(family = "Arial")) + theme(text = element_text(size = 15)) + theme(plot.title = element_text(size = 20)) + theme(plot.title = element_text(family = "Roboto Slab")) + theme(plot.title.position = "plot") + labs(x = "Election Year") + labs(y = NULL) + labs(title = "Percent of democrat votes by state") + labs(subtitle = "We're a swing state! Go vote!") + theme(plot.subtitle = element_text(face = "italic")) ``` ] .panel2-text-rotate[ <!-- --> ] --- count: false .panel1-text-rotate[ ```r state_election_plot + * theme(text = element_text(family = "xkcd")) + theme(text = element_text(size = 15)) + theme(plot.title = element_text(size = 20)) + theme(plot.title = element_text(family = "Roboto Slab")) + theme(plot.title.position = "plot") + labs(x = "Election Year") + labs(y = NULL) + labs(title = "Percent of democrat votes by state") + labs(subtitle = "We're a swing state! Go vote!") + theme(plot.subtitle = element_text(face = "italic")) ``` ] .panel2-text-rotate[ <!-- --> ] <style> .panel1-text-rotate { color: black; width: 39.2%; hight: 32%; float: left; padding-left: 1%; font-size: 80% } .panel2-text-rotate { color: black; width: 58.8%; hight: 32%; float: left; padding-left: 1%; font-size: 80% } .panel3-text-rotate { color: black; width: NA%; hight: 33%; float: left; padding-left: 1%; font-size: 80% } </style> --- #1. Text (End!) .pull-left[ ```r state_election_plot + theme( text = element_text(size = 16, family = "Roboto"), plot.title = element_text(size = 20, family = "Roboto Slab"), plot.title.position = "plot", plot.subtitle = element_text(face = "italic"), axis.text = element_text(size = 14) ) + labs( x = "Election Year", y = NULL, title = "Percent of democrat votes by state", subtitle = "We're a swing state! Go vote!" ) ``` Save our progress! ```r state_election_plot_A ``` ] .pull-right[ <img src="P_lab_ggplot2_files/figure-html/text_final-1.png" width="400px" /> ] --- #1. Text (Before-After) .pull-left[ <img src="P_lab_ggplot2_files/figure-html/unnamed-chunk-9-1.png" width="400px" /> ] .pull-right[ <img src="P_lab_ggplot2_files/figure-html/unnamed-chunk-10-1.png" width="400px" /> ] --- #2. Margins & Spacing <img src="P_lab_ggplot2_files/figure-html/unnamed-chunk-11-1.png" height="450px" style="display: block; margin: auto;" /> --- #2. Margins & Spacing <img src="P_lab_ggplot2_files/figure-html/unnamed-chunk-12-1.png" height="450px" style="display: block; margin: auto;" /> --- #2. Margins & Spacing <img src="P_lab_ggplot2_files/figure-html/unnamed-chunk-13-1.png" height="450px" style="display: block; margin: auto;" /> --- #2. Margins & Spacing Base {ggplot2} themes don't have _great_ margin defaults for: -- - <p>Margins around plot</p> -- - Margins between plot title and panel -- - Margins between axis titles and panel -- - Margins between axis texts and axis title -- <br> Know your margin/spacing elements! - `margin(t = 0, r = 0, b = 0, l = 0, unit = c("pt", "mm", "cm", "in"))` - `hjust`, `vjust`, and `lineheight` in `element_text()` - `expand` in `scale_*()`/`coord_*()` --- count: false .panel1-margins-auto[ ```r *state_election_plot_A ``` ] .panel2-margins-auto[ <!-- --> ] --- count: false .panel1-margins-auto[ ```r state_election_plot_A + * theme( * plot.background = element_rect(color = 'black') * ) ``` ] .panel2-margins-auto[ <!-- --> ] --- count: false .panel1-margins-auto[ ```r state_election_plot_A + theme( plot.background = element_rect(color = 'black') ) + * theme( * plot.margin = margin(1, .8, .8, .8, "cm") * ) ``` ] .panel2-margins-auto[ <!-- --> ] --- count: false .panel1-margins-auto[ ```r state_election_plot_A + theme( plot.background = element_rect(color = 'black') ) + theme( plot.margin = margin(1, .8, .8, .8, "cm") ) + * theme( * plot.title = element_text(margin = margin(b = .3, unit = "cm")) * ) ``` ] .panel2-margins-auto[ <!-- --> ] --- count: false .panel1-margins-auto[ ```r state_election_plot_A + theme( plot.background = element_rect(color = 'black') ) + theme( plot.margin = margin(1, .8, .8, .8, "cm") ) + theme( plot.title = element_text(margin = margin(b = .3, unit = "cm")) ) + * theme( * plot.subtitle = element_text(margin = margin(b = .3, unit = "cm")) * ) ``` ] .panel2-margins-auto[ <!-- --> ] --- count: false .panel1-margins-auto[ ```r state_election_plot_A + theme( plot.background = element_rect(color = 'black') ) + theme( plot.margin = margin(1, .8, .8, .8, "cm") ) + theme( plot.title = element_text(margin = margin(b = .3, unit = "cm")) ) + theme( plot.subtitle = element_text(margin = margin(b = .3, unit = "cm")) ) + * theme( * axis.text.x = element_text(margin = margin(t = .2, unit = "cm")) * ) ``` ] .panel2-margins-auto[ <!-- --> ] --- count: false .panel1-margins-auto[ ```r state_election_plot_A + theme( plot.background = element_rect(color = 'black') ) + theme( plot.margin = margin(1, .8, .8, .8, "cm") ) + theme( plot.title = element_text(margin = margin(b = .3, unit = "cm")) ) + theme( plot.subtitle = element_text(margin = margin(b = .3, unit = "cm")) ) + theme( axis.text.x = element_text(margin = margin(t = .2, unit = "cm")) ) + * theme( * axis.text.y = element_text(margin = margin(r = .1, unit = "cm")) * ) ``` ] .panel2-margins-auto[ <!-- --> ] --- count: false .panel1-margins-auto[ ```r state_election_plot_A + theme( plot.background = element_rect(color = 'black') ) + theme( plot.margin = margin(1, .8, .8, .8, "cm") ) + theme( plot.title = element_text(margin = margin(b = .3, unit = "cm")) ) + theme( plot.subtitle = element_text(margin = margin(b = .3, unit = "cm")) ) + theme( axis.text.x = element_text(margin = margin(t = .2, unit = "cm")) ) + theme( axis.text.y = element_text(margin = margin(r = .1, unit = "cm")) ) + * theme( * axis.title.x = element_text(margin = margin(t = .3, unit = "cm")) * ) ``` ] .panel2-margins-auto[ <!-- --> ] --- count: false .panel1-margins-auto[ ```r state_election_plot_A + theme( plot.background = element_rect(color = 'black') ) + theme( plot.margin = margin(1, .8, .8, .8, "cm") ) + theme( plot.title = element_text(margin = margin(b = .3, unit = "cm")) ) + theme( plot.subtitle = element_text(margin = margin(b = .3, unit = "cm")) ) + theme( axis.text.x = element_text(margin = margin(t = .2, unit = "cm")) ) + theme( axis.text.y = element_text(margin = margin(r = .1, unit = "cm")) ) + theme( axis.title.x = element_text(margin = margin(t = .3, unit = "cm")) ) + * coord_cartesian(expand = FALSE) ``` ] .panel2-margins-auto[ <!-- --> ] <style> .panel1-margins-auto { color: black; width: 39.2%; hight: 32%; float: left; padding-left: 1%; font-size: 80% } .panel2-margins-auto { color: black; width: 58.8%; hight: 32%; float: left; padding-left: 1%; font-size: 80% } .panel3-margins-auto { color: black; width: NA%; hight: 33%; float: left; padding-left: 1%; font-size: 80% } </style> --- count: false .panel1-margins-rotate[ ```r state_election_plot_A + theme( plot.background = element_rect(color = 'black') ) + theme( plot.margin = margin(1, .8, .8, .8, "cm") ) + theme( plot.title = element_text(margin = margin(b = .3, unit = "cm")) ) + theme( plot.subtitle = element_text(margin = margin(b = .3, unit = "cm")) ) + theme( axis.text.x = element_text(margin = margin(t = .2, unit = "cm")) ) + theme( axis.text.y = element_text(margin = margin(r = .1, unit = "cm")) ) + theme( axis.title.x = element_text(margin = margin(t = .3, unit = "cm")) ) + * scale_x_continuous(expand = expansion(mult = 0, add = 3)) ``` ] .panel2-margins-rotate[ <!-- --> ] --- count: false .panel1-margins-rotate[ ```r state_election_plot_A + theme( plot.background = element_rect(color = 'black') ) + theme( plot.margin = margin(1, .8, .8, .8, "cm") ) + theme( plot.title = element_text(margin = margin(b = .3, unit = "cm")) ) + theme( plot.subtitle = element_text(margin = margin(b = .3, unit = "cm")) ) + theme( axis.text.x = element_text(margin = margin(t = .2, unit = "cm")) ) + theme( axis.text.y = element_text(margin = margin(r = .1, unit = "cm")) ) + theme( axis.title.x = element_text(margin = margin(t = .3, unit = "cm")) ) + * scale_x_continuous(expand = expansion(mult = 0, add = 3), breaks = pretty_breaks(5)) ``` ] .panel2-margins-rotate[ <!-- --> ] <style> .panel1-margins-rotate { color: black; width: 39.2%; hight: 32%; float: left; padding-left: 1%; font-size: 80% } .panel2-margins-rotate { color: black; width: 58.8%; hight: 32%; float: left; padding-left: 1%; font-size: 80% } .panel3-margins-rotate { color: black; width: NA%; hight: 33%; float: left; padding-left: 1%; font-size: 80% } </style> --- #2. Margins & Spacing (End!) .pull-left[ ```r state_election_plot_A + theme( plot.margin = margin(1, .8, .8, .8, "cm"), plot.title = element_text(margin = margin(b = .3, unit = "cm")), plot.subtitle = element_text(margin = margin(b = .3, unit = "cm")), axis.text.x = element_text(margin = margin(t = .2, unit = "cm")), axis.text.y = element_text(margin = margin(r = .1, unit = "cm")), axis.title.x = element_text(margin = margin(t = .3, unit = "cm")) ) + scale_x_continuous( expand = expansion(mult = 0, add = 3), breaks = pretty_breaks(5) ) ``` Save our progress! ```r state_election_plot_B ``` ] .pull-right[ <img src="P_lab_ggplot2_files/figure-html/margins_final-1.png" width="400px" /> ] --- #2. Margins & Spacing (Before-After) .pull-left[ <img src="P_lab_ggplot2_files/figure-html/unnamed-chunk-16-1.png" width="400px" /> ] .pull-right[ <img src="P_lab_ggplot2_files/figure-html/unnamed-chunk-17-1.png" width="400px" /> ] --- class: inverse #2. Margins & Spacing (Before-After) .pull-left[ <img src="P_lab_ggplot2_files/figure-html/unnamed-chunk-18-1.png" width="400px" /> ] .pull-right[ <img src="P_lab_ggplot2_files/figure-html/unnamed-chunk-19-1.png" width="400px" /> ] --- #3. Legends -- Legends are really hard: -- - <p>They contain important info, but difficult to make them not look out of place</p> -- - It's better not to have a legend, if you can get away with it -- - But sometimes we don't have the luxury of doing so -- <br> Alternative: consider _labeling the data directly_ --- class: inverse, center, middle <img src="P_lab_ggplot2_files/538plots.gif" width="550px" /> --- #3. Legends Legends are really hard: - <p>They contain important info, but difficult to make them not look out of place</p> - It's better not to have a legend, if you can get away with it - But sometimes we don't have the luxury of doing so <br> Alternative: consider _labeling the data directly_ -- <br> But if you must have a legend, make it so that the reader **_can't help_** but to look at -- - <p>Positioned at the top-left or top-center of the plot</p> -- - Blend smoothly into the rest of the plot (_NOT_ make them stand out!) --- count: false .panel1-legends2-auto[ ```r *state_election_plot_B ``` ] .panel2-legends2-auto[ <!-- --> ] --- count: false .panel1-legends2-auto[ ```r state_election_plot_B + * theme( * legend.key = element_rect(fill = NA) * ) ``` ] .panel2-legends2-auto[ <!-- --> ] --- count: false .panel1-legends2-auto[ ```r state_election_plot_B + theme( legend.key = element_rect(fill = NA) ) + * theme( * legend.position = c(.45, .93) * ) ``` ] .panel2-legends2-auto[ <!-- --> ] --- count: false .panel1-legends2-auto[ ```r state_election_plot_B + theme( legend.key = element_rect(fill = NA) ) + theme( legend.position = c(.45, .93) ) + * theme( * legend.direction = "horizontal" * ) ``` ] .panel2-legends2-auto[ <!-- --> ] --- count: false .panel1-legends2-auto[ ```r state_election_plot_B + theme( legend.key = element_rect(fill = NA) ) + theme( legend.position = c(.45, .93) ) + theme( legend.direction = "horizontal" ) + * theme( * legend.background = element_rect(fill = "grey92") * ) ``` ] .panel2-legends2-auto[ <!-- --> ] --- count: false .panel1-legends2-auto[ ```r state_election_plot_B + theme( legend.key = element_rect(fill = NA) ) + theme( legend.position = c(.45, .93) ) + theme( legend.direction = "horizontal" ) + theme( legend.background = element_rect(fill = "grey92") ) + * scale_y_continuous( * expand = expansion(0, .05), * labels = percent_format(accuracy = 1) * ) ``` ] .panel2-legends2-auto[ <!-- --> ] --- count: false .panel1-legends2-auto[ ```r state_election_plot_B + theme( legend.key = element_rect(fill = NA) ) + theme( legend.position = c(.45, .93) ) + theme( legend.direction = "horizontal" ) + theme( legend.background = element_rect(fill = "grey92") ) + scale_y_continuous( expand = expansion(0, .05), labels = percent_format(accuracy = 1) ) + * labs(color = NULL) ``` ] .panel2-legends2-auto[ <!-- --> ] <style> .panel1-legends2-auto { color: black; width: 39.2%; hight: 32%; float: left; padding-left: 1%; font-size: 80% } .panel2-legends2-auto { color: black; width: 58.8%; hight: 32%; float: left; padding-left: 1%; font-size: 80% } .panel3-legends2-auto { color: black; width: NA%; hight: 33%; float: left; padding-left: 1%; font-size: 80% } </style> --- #3. Legends (End!) .pull-left[ ```r state_election_plot_B + theme( legend.key = element_rect(fill = NA), legend.position = c(.45, .93), legend.direction = "horizontal", legend.background = element_rect(fill = "grey92") ) + scale_y_continuous( expand = expansion(0, .05), labels = percent_format(accuracy = 1) ) + labs(color = NULL) ``` Save our progress! ```r state_election_plot_C ``` ] .pull-right[ <img src="P_lab_ggplot2_files/figure-html/legends_final-1.png" width="400px" /> ] --- #3. Legends (Before-After) .pull-left[ <img src="P_lab_ggplot2_files/figure-html/unnamed-chunk-23-1.png" width="400px" /> ] .pull-right[ <img src="P_lab_ggplot2_files/figure-html/unnamed-chunk-24-1.png" width="400px" /> ] --- #4. Color -- Colors are a double-edged sword -- - <p>Perception can vary widely depending on reader, medium, culture, etc.</p> -- - There are multiple, complex representations (RGB, wavelength, hex, [HSV](https://colordesigner.io/convert/hextohsv)) --- class: center, middle <img src="https://yjunechoe.github.io/posts/2020-10-22-analysis-of-everycolorbots-tweets/HSV.png" width="600px" /> --- #4. Color Colors are a double-edged sword - Perception can vary widely depending on reader, medium, culture, etc. - There are multiple, complex representations (RGB, wavelength, hex, [HSV](https://colordesigner.io/convert/hextohsv)) -- <br> If you must, DO: -- - <p>Avoid pure colors (no random sampling from the rainbow!)</p> -- - Contrast colors in more than one dimension --- class: center, middle <img src="P_lab_ggplot2_files/avoid_pure_colors.png" width="650px" /> <br> source: https://blog.datawrapper.de/beautifulcolors/ --- class: center, middle <img src="P_lab_ggplot2_files/combine_diff_dimensions.png" width="650px" /> <br> source: https://blog.datawrapper.de/beautifulcolors/ --- #4. Color Colors are a double-edged sword - Perception can vary widely depending on reader, medium, culture, etc. - There are multiple, complex representations (RGB, wavelength, hex, [HSV](https://colordesigner.io/convert/hextohsv)) <br> If you must, DO: - Avoid pure colors (no random sampling from the rainbow!) - Contrast colors in more than one dimension <br> If you aren't sure, use [pre-made palettes](https://github.com/EmilHvitfeldt/paletteer) or play around with [online color tools](https://color.adobe.com/create/color-wheel) --- class: center, middle <iframe src="https://paletton.com/" height="600px" width="1050px"> --- count: false .panel1-colors1-auto[ ```r *state_election_plot_C ``` ] .panel2-colors1-auto[ <!-- --> ] --- count: false .panel1-colors1-auto[ ```r state_election_plot_C + * theme(panel.background = element_rect(fill = NA)) ``` ] .panel2-colors1-auto[ <!-- --> ] --- count: false .panel1-colors1-auto[ ```r state_election_plot_C + theme(panel.background = element_rect(fill = NA)) + * theme(legend.background = element_rect(fill = NA)) ``` ] .panel2-colors1-auto[ <!-- --> ] --- count: false .panel1-colors1-auto[ ```r state_election_plot_C + theme(panel.background = element_rect(fill = NA)) + theme(legend.background = element_rect(fill = NA)) + * theme(axis.line = element_line()) ``` ] .panel2-colors1-auto[ <!-- --> ] --- count: false .panel1-colors1-auto[ ```r state_election_plot_C + theme(panel.background = element_rect(fill = NA)) + theme(legend.background = element_rect(fill = NA)) + theme(axis.line = element_line()) + * scale_color_manual( * values = c("#F8766D", "#00BA38", "#619CFF") * ) ``` ] .panel2-colors1-auto[ <!-- --> ] --- count: false .panel1-colors1-auto[ ```r state_election_plot_C + theme(panel.background = element_rect(fill = NA)) + theme(legend.background = element_rect(fill = NA)) + theme(axis.line = element_line()) + scale_color_manual( values = c("#F8766D", "#00BA38", "#619CFF") ) + * scale_color_manual( * values = c( * hex(HSV( 4, 0.56, 0.97)), * hex(HSV(138, 1, 0.73)), * hex(HSV(218, 0.62, 1)) * ) * ) ``` ] .panel2-colors1-auto[ <!-- --> ] --- count: false .panel1-colors1-auto[ ```r state_election_plot_C + theme(panel.background = element_rect(fill = NA)) + theme(legend.background = element_rect(fill = NA)) + theme(axis.line = element_line()) + scale_color_manual( values = c("#F8766D", "#00BA38", "#619CFF") ) + scale_color_manual( values = c( hex(HSV( 4, 0.56, 0.97)), hex(HSV(138, 1, 0.73)), hex(HSV(218, 0.62, 1)) ) ) + * scale_color_manual( * values = c( * hex(HSV( 0, 1, 1)), * hex(HSV(120, 1, 1)), * hex(HSV(210, 1, 1)) * ) * ) ``` ] .panel2-colors1-auto[ <!-- --> ] --- count: false .panel1-colors1-auto[ ```r state_election_plot_C + theme(panel.background = element_rect(fill = NA)) + theme(legend.background = element_rect(fill = NA)) + theme(axis.line = element_line()) + scale_color_manual( values = c("#F8766D", "#00BA38", "#619CFF") ) + scale_color_manual( values = c( hex(HSV( 4, 0.56, 0.97)), hex(HSV(138, 1, 0.73)), hex(HSV(218, 0.62, 1)) ) ) + scale_color_manual( values = c( hex(HSV( 0, 1, 1)), hex(HSV(120, 1, 1)), hex(HSV(210, 1, 1)) ) ) + * scale_color_manual( * values = c( * hex(HSV( 42, 0.56, 0.84)), * hex(HSV(133, 0.17, 0.57)), * hex(HSV(205, 0.75, 0.51)) * ) * ) ``` ] .panel2-colors1-auto[ <!-- --> ] --- count: false .panel1-colors1-auto[ ```r state_election_plot_C + theme(panel.background = element_rect(fill = NA)) + theme(legend.background = element_rect(fill = NA)) + theme(axis.line = element_line()) + scale_color_manual( values = c("#F8766D", "#00BA38", "#619CFF") ) + scale_color_manual( values = c( hex(HSV( 4, 0.56, 0.97)), hex(HSV(138, 1, 0.73)), hex(HSV(218, 0.62, 1)) ) ) + scale_color_manual( values = c( hex(HSV( 0, 1, 1)), hex(HSV(120, 1, 1)), hex(HSV(210, 1, 1)) ) ) + scale_color_manual( values = c( hex(HSV( 42, 0.56, 0.84)), hex(HSV(133, 0.17, 0.57)), hex(HSV(205, 0.75, 0.51)) ) ) + * scale_color_manual( * values = c("#D6B25E", "#79917E", "#215982") * ) ``` ] .panel2-colors1-auto[ <!-- --> ] --- count: false .panel1-colors1-auto[ ```r state_election_plot_C + theme(panel.background = element_rect(fill = NA)) + theme(legend.background = element_rect(fill = NA)) + theme(axis.line = element_line()) + scale_color_manual( values = c("#F8766D", "#00BA38", "#619CFF") ) + scale_color_manual( values = c( hex(HSV( 4, 0.56, 0.97)), hex(HSV(138, 1, 0.73)), hex(HSV(218, 0.62, 1)) ) ) + scale_color_manual( values = c( hex(HSV( 0, 1, 1)), hex(HSV(120, 1, 1)), hex(HSV(210, 1, 1)) ) ) + scale_color_manual( values = c( hex(HSV( 42, 0.56, 0.84)), hex(HSV(133, 0.17, 0.57)), hex(HSV(205, 0.75, 0.51)) ) ) + scale_color_manual( values = c("#D6B25E", "#79917E", "#215982") ) + * geom_line(size = 1.5) ``` ] .panel2-colors1-auto[ <!-- --> ] <style> .panel1-colors1-auto { color: black; width: 39.2%; hight: 32%; float: left; padding-left: 1%; font-size: 80% } .panel2-colors1-auto { color: black; width: 58.8%; hight: 32%; float: left; padding-left: 1%; font-size: 80% } .panel3-colors1-auto { color: black; width: NA%; hight: 33%; float: left; padding-left: 1%; font-size: 80% } </style> --- ```r library(colorBlindness) ``` <br> <img src="P_lab_ggplot2_files/CBplot.png" width="850px" style="display: block; margin: auto;" /> --- count: false .panel1-themes-rotate[ ```r state_election_plot_C + theme(panel.background = element_rect(fill = NA)) + theme(legend.background = element_rect(fill = NA)) + theme(axis.line = element_line()) + geom_line(size = 1.5) + * ggthemes::scale_color_colorblind() ``` ] .panel2-themes-rotate[ <!-- --> ] --- count: false .panel1-themes-rotate[ ```r state_election_plot_C + theme(panel.background = element_rect(fill = NA)) + theme(legend.background = element_rect(fill = NA)) + theme(axis.line = element_line()) + geom_line(size = 1.5) + * nord::scale_color_nord(palette = "aurora", discrete = TRUE) ``` ] .panel2-themes-rotate[ <!-- --> ] --- count: false .panel1-themes-rotate[ ```r state_election_plot_C + theme(panel.background = element_rect(fill = NA)) + theme(legend.background = element_rect(fill = NA)) + theme(axis.line = element_line()) + geom_line(size = 1.5) + * ggsci::scale_color_simpsons() ``` ] .panel2-themes-rotate[ <!-- --> ] --- count: false .panel1-themes-rotate[ ```r state_election_plot_C + theme(panel.background = element_rect(fill = NA)) + theme(legend.background = element_rect(fill = NA)) + theme(axis.line = element_line()) + geom_line(size = 1.5) + * ghibli::scale_color_ghibli_d("SpiritedDark", direction = -1) ``` ] .panel2-themes-rotate[ <!-- --> ] --- count: false .panel1-themes-rotate[ ```r state_election_plot_C + theme(panel.background = element_rect(fill = NA)) + theme(legend.background = element_rect(fill = NA)) + theme(axis.line = element_line()) + geom_line(size = 1.5) + * scale_color_manual(values = wesanderson::wes_palette("Moonrise2", 3, "discrete")) ``` ] .panel2-themes-rotate[ <!-- --> ] --- count: false .panel1-themes-rotate[ ```r state_election_plot_C + theme(panel.background = element_rect(fill = NA)) + theme(legend.background = element_rect(fill = NA)) + theme(axis.line = element_line()) + geom_line(size = 1.5) + * palettetown::scale_color_poke(pokemon = "pikachu") ``` ] .panel2-themes-rotate[ <!-- --> ] --- count: false .panel1-themes-rotate[ ```r state_election_plot_C + theme(panel.background = element_rect(fill = NA)) + theme(legend.background = element_rect(fill = NA)) + theme(axis.line = element_line()) + geom_line(size = 1.5) + * scale_color_manual(values = LaCroixColoR::lacroix_palette("PeachPear", 3, "discrete")) ``` ] .panel2-themes-rotate[ <!-- --> ] <style> .panel1-themes-rotate { color: black; width: 39.2%; hight: 32%; float: left; padding-left: 1%; font-size: 80% } .panel2-themes-rotate { color: black; width: 58.8%; hight: 32%; float: left; padding-left: 1%; font-size: 80% } .panel3-themes-rotate { color: black; width: NA%; hight: 33%; float: left; padding-left: 1%; font-size: 80% } </style> --- count: false .panel1-colors2-auto[ ```r *state_election_plot_C ``` ] .panel2-colors2-auto[ <!-- --> ] --- count: false .panel1-colors2-auto[ ```r state_election_plot_C + * theme( * panel.background = element_rect(fill = NA) * ) ``` ] .panel2-colors2-auto[ <!-- --> ] --- count: false .panel1-colors2-auto[ ```r state_election_plot_C + theme( panel.background = element_rect(fill = NA) ) + * theme( * legend.background = element_rect(fill = NA) * ) ``` ] .panel2-colors2-auto[ <!-- --> ] --- count: false .panel1-colors2-auto[ ```r state_election_plot_C + theme( panel.background = element_rect(fill = NA) ) + theme( legend.background = element_rect(fill = NA) ) + * theme( * axis.line = element_line() * ) ``` ] .panel2-colors2-auto[ <!-- --> ] --- count: false .panel1-colors2-auto[ ```r state_election_plot_C + theme( panel.background = element_rect(fill = NA) ) + theme( legend.background = element_rect(fill = NA) ) + theme( axis.line = element_line() ) + * scale_color_manual( * values = c("#e1e1e1", "#e1e1e1", "#2b5e82") * ) ``` ] .panel2-colors2-auto[ <!-- --> ] --- count: false .panel1-colors2-auto[ ```r state_election_plot_C + theme( panel.background = element_rect(fill = NA) ) + theme( legend.background = element_rect(fill = NA) ) + theme( axis.line = element_line() ) + scale_color_manual( values = c("#e1e1e1", "#e1e1e1", "#2b5e82") ) + * guides( * color = guide_none() * ) ``` ] .panel2-colors2-auto[ <!-- --> ] --- count: false .panel1-colors2-auto[ ```r state_election_plot_C + theme( panel.background = element_rect(fill = NA) ) + theme( legend.background = element_rect(fill = NA) ) + theme( axis.line = element_line() ) + scale_color_manual( values = c("#e1e1e1", "#e1e1e1", "#2b5e82") ) + guides( color = guide_none() ) + * labs(subtitle = "<span style='color:#2b5e82'>Pennsylvania</span> is a swing state! Go vote!") ``` ] .panel2-colors2-auto[ <!-- --> ] --- count: false .panel1-colors2-auto[ ```r state_election_plot_C + theme( panel.background = element_rect(fill = NA) ) + theme( legend.background = element_rect(fill = NA) ) + theme( axis.line = element_line() ) + scale_color_manual( values = c("#e1e1e1", "#e1e1e1", "#2b5e82") ) + guides( color = guide_none() ) + labs(subtitle = "<span style='color:#2b5e82'>Pennsylvania</span> is a swing state! Go vote!") + * theme( * plot.subtitle = ggtext::element_markdown() * ) ``` ] .panel2-colors2-auto[ <!-- --> ] --- count: false .panel1-colors2-auto[ ```r state_election_plot_C + theme( panel.background = element_rect(fill = NA) ) + theme( legend.background = element_rect(fill = NA) ) + theme( axis.line = element_line() ) + scale_color_manual( values = c("#e1e1e1", "#e1e1e1", "#2b5e82") ) + guides( color = guide_none() ) + labs(subtitle = "<span style='color:#2b5e82'>Pennsylvania</span> is a swing state! Go vote!") + theme( plot.subtitle = ggtext::element_markdown() ) + * geom_line(size = 1.5) ``` ] .panel2-colors2-auto[ <!-- --> ] <style> .panel1-colors2-auto { color: black; width: 39.2%; hight: 32%; float: left; padding-left: 1%; font-size: 80% } .panel2-colors2-auto { color: black; width: 58.8%; hight: 32%; float: left; padding-left: 1%; font-size: 80% } .panel3-colors2-auto { color: black; width: NA%; hight: 33%; float: left; padding-left: 1%; font-size: 80% } </style> --- count: false .panel1-colors2-rotate[ ```r state_election_plot_C + theme( panel.background = element_rect(fill = NA) ) + theme( legend.background = element_rect(fill = NA) ) + theme( axis.line = element_line() ) + scale_color_manual( values = c("#e1e1e1", "#e1e1e1", "#2b5e82") ) + guides( color = guide_none() ) + * labs(subtitle = "<span style='color:#0E4369'>Pennsylvania</span> is a swing state! Go vote!") + theme( plot.subtitle = ggtext::element_markdown() ) + geom_line(size = 1.5) ``` ] .panel2-colors2-rotate[ <!-- --> ] --- count: false .panel1-colors2-rotate[ ```r state_election_plot_C + theme( panel.background = element_rect(fill = NA) ) + theme( legend.background = element_rect(fill = NA) ) + theme( axis.line = element_line() ) + scale_color_manual( values = c("#e1e1e1", "#e1e1e1", "#2b5e82") ) + guides( color = guide_none() ) + * labs(subtitle = "<strong style='color:#0E4369'>Pennsylvania</strong> is a swing state! Go vote!") + theme( plot.subtitle = ggtext::element_markdown() ) + geom_line(size = 1.5) ``` ] .panel2-colors2-rotate[ <!-- --> ] <style> .panel1-colors2-rotate { color: black; width: 39.2%; hight: 32%; float: left; padding-left: 1%; font-size: 80% } .panel2-colors2-rotate { color: black; width: 58.8%; hight: 32%; float: left; padding-left: 1%; font-size: 80% } .panel3-colors2-rotate { color: black; width: NA%; hight: 33%; float: left; padding-left: 1%; font-size: 80% } </style> --- #4. Colors (End!) .pull-left[ ```r state_election_plot_C + geom_line(size = 1.5) + theme( panel.background = element_rect(fill = NA), legend.background = element_rect(fill = NA), axis.line = element_line(), plot.subtitle = element_markdown() ) + guides(color = guide_none()) + scale_color_manual(values = c("#e1e1e1", "#e1e1e1", "#2b5e82")) + labs( subtitle = "<strong style='color:#0E4369'>Pennsylvania</strong> is a swing state! Go vote!" ) ``` Save our progress! ```r state_election_plot_D ``` ] .pull-right[ <img src="P_lab_ggplot2_files/figure-html/colors_final-1.png" width="400px" /> ] --- #4. Colors (Before-After) .pull-left[ <img src="P_lab_ggplot2_files/figure-html/unnamed-chunk-33-1.png" width="400px" /> ] .pull-right[ <img src="P_lab_ggplot2_files/figure-html/colors1-1.png" width="400px" /> ] --- #4. Colors (Before-After) .pull-left[ <img src="P_lab_ggplot2_files/figure-html/unnamed-chunk-34-1.png" width="400px" /> ] .pull-right[ <img src="P_lab_ggplot2_files/figure-html/unnamed-chunk-35-1.png" width="400px" /> ] --- class: inverse, center, middle <img src="P_lab_ggplot2_files/final.gif" width="500px" /> --- count: false .panel1-final-auto[ ```r *state_election_plot ``` ] .panel2-final-auto[ <!-- --> ] --- count: false .panel1-final-auto[ ```r state_election_plot + * theme_classic( * base_family = "Roboto", * base_size = 16 * ) ``` ] .panel2-final-auto[ <!-- --> ] --- count: false .panel1-final-auto[ ```r state_election_plot + theme_classic( base_family = "Roboto", base_size = 16 ) + * guides(color = guide_none()) ``` ] .panel2-final-auto[ <!-- --> ] --- count: false .panel1-final-auto[ ```r state_election_plot + theme_classic( base_family = "Roboto", base_size = 16 ) + guides(color = guide_none()) + * geom_line(size = 1.5) ``` ] .panel2-final-auto[ <!-- --> ] --- count: false .panel1-final-auto[ ```r state_election_plot + theme_classic( base_family = "Roboto", base_size = 16 ) + guides(color = guide_none()) + geom_line(size = 1.5) + * scale_color_manual( * values = c("#e1e1e1", "#e1e1e1", "#2b5e82") * ) ``` ] .panel2-final-auto[ <!-- --> ] --- count: false .panel1-final-auto[ ```r state_election_plot + theme_classic( base_family = "Roboto", base_size = 16 ) + guides(color = guide_none()) + geom_line(size = 1.5) + scale_color_manual( values = c("#e1e1e1", "#e1e1e1", "#2b5e82") ) + * labs( * y = NULL, * x = "Election Year", * title = "Percent of democrat votes by state", * subtitle = "<strong style='color:#0E4369'>Pennsylvania</strong> is a swing state! Go vote!" * ) ``` ] .panel2-final-auto[ <!-- --> ] --- count: false .panel1-final-auto[ ```r state_election_plot + theme_classic( base_family = "Roboto", base_size = 16 ) + guides(color = guide_none()) + geom_line(size = 1.5) + scale_color_manual( values = c("#e1e1e1", "#e1e1e1", "#2b5e82") ) + labs( y = NULL, x = "Election Year", title = "Percent of democrat votes by state", subtitle = "<strong style='color:#0E4369'>Pennsylvania</strong> is a swing state! Go vote!" ) + * theme( * plot.margin = margin(.8, 1, .7, .8, "cm"), * plot.title = element_text( * family = "Roboto Slab", * size = 24, * margin = margin(b = .3, unit = "cm") * ), * plot.title.position = "plot", * plot.subtitle = element_markdown( * margin = margin(b = .3, unit = "cm") * ), * axis.title.x = element_text( * margin = margin(t = .5, unit = "cm") * ), * ) ``` ] .panel2-final-auto[ <!-- --> ] <style> .panel1-final-auto { color: black; width: 39.2%; hight: 32%; float: left; padding-left: 1%; font-size: 80% } .panel2-final-auto { color: black; width: 58.8%; hight: 32%; float: left; padding-left: 1%; font-size: 80% } .panel3-final-auto { color: black; width: NA%; hight: 33%; float: left; padding-left: 1%; font-size: 80% } </style> --- class: inverse, center, middle # Showcasing --- # First, save our theme! .pull-left[ You can set global theme with `theme_set()` and `theme_update()`: <br> - `theme_set()` takes a custom theme as a argument (e.g., `theme_bw()`, `theme_classic()`, etc.) <br> - `theme_update()` takes individual theme elements as arguments <br> ] .pull-right[ ```r theme_set( theme_classic( base_family = "Roboto", base_size = 16 ) ) theme_update( plot.margin = margin(.8, 1, .7, .8, "cm"), plot.title = element_text( family = "Roboto Slab", size = 24, margin = margin(b = .5, unit = "cm") ), plot.title.position = "plot", axis.title.x = element_text( margin = margin(t = .5, unit = "cm") ) ) ``` ] --- class: inverse, center, middle ## 1. Vowel Formant Plot --- count: false .panel1-vowels1-auto[ ```r *sim_vowel_data ``` ] .panel2-vowels1-auto[ ``` # A tibble: 300 x 3 Vowel F1 F2 <chr> <dbl> <dbl> 1 i 371. 2431. 2 i 332. 2435. 3 i 286. 2630. 4 i 110. 2527. 5 i 302. 2315. 6 i 199. 2279. 7 i 152. 2303. 8 i 173. 2116. 9 i 258. 2540. 10 i 200. 2604. # ... with 290 more rows ``` ] --- count: false .panel1-vowels1-auto[ ```r sim_vowel_data %>% * ggplot(aes(x = F2, y = F1)) ``` ] .panel2-vowels1-auto[ <!-- --> ] --- count: false .panel1-vowels1-auto[ ```r sim_vowel_data %>% ggplot(aes(x = F2, y = F1)) + * geom_text(aes(label = Vowel)) ``` ] .panel2-vowels1-auto[ <!-- --> ] --- count: false .panel1-vowels1-auto[ ```r sim_vowel_data %>% ggplot(aes(x = F2, y = F1)) + geom_text(aes(label = Vowel)) + * scale_x_reverse( * position = "top", * breaks = pretty_breaks(5) * ) ``` ] .panel2-vowels1-auto[ <!-- --> ] --- count: false .panel1-vowels1-auto[ ```r sim_vowel_data %>% ggplot(aes(x = F2, y = F1)) + geom_text(aes(label = Vowel)) + scale_x_reverse( position = "top", breaks = pretty_breaks(5) ) + * scale_y_reverse(position = "right") ``` ] .panel2-vowels1-auto[ <!-- --> ] --- count: false .panel1-vowels1-auto[ ```r sim_vowel_data %>% ggplot(aes(x = F2, y = F1)) + geom_text(aes(label = Vowel)) + scale_x_reverse( position = "top", breaks = pretty_breaks(5) ) + scale_y_reverse(position = "right") + * theme( * plot.margin = margin(.5,.5, 1, 1, unit = "cm"), * axis.title.x.top = element_text(margin = margin(b = .2, unit = "cm")), * axis.title.y.right = element_text( * angle = 0, vjust = 0.5, margin = margin(l = .3, unit = "cm") * ) * ) ``` ] .panel2-vowels1-auto[ 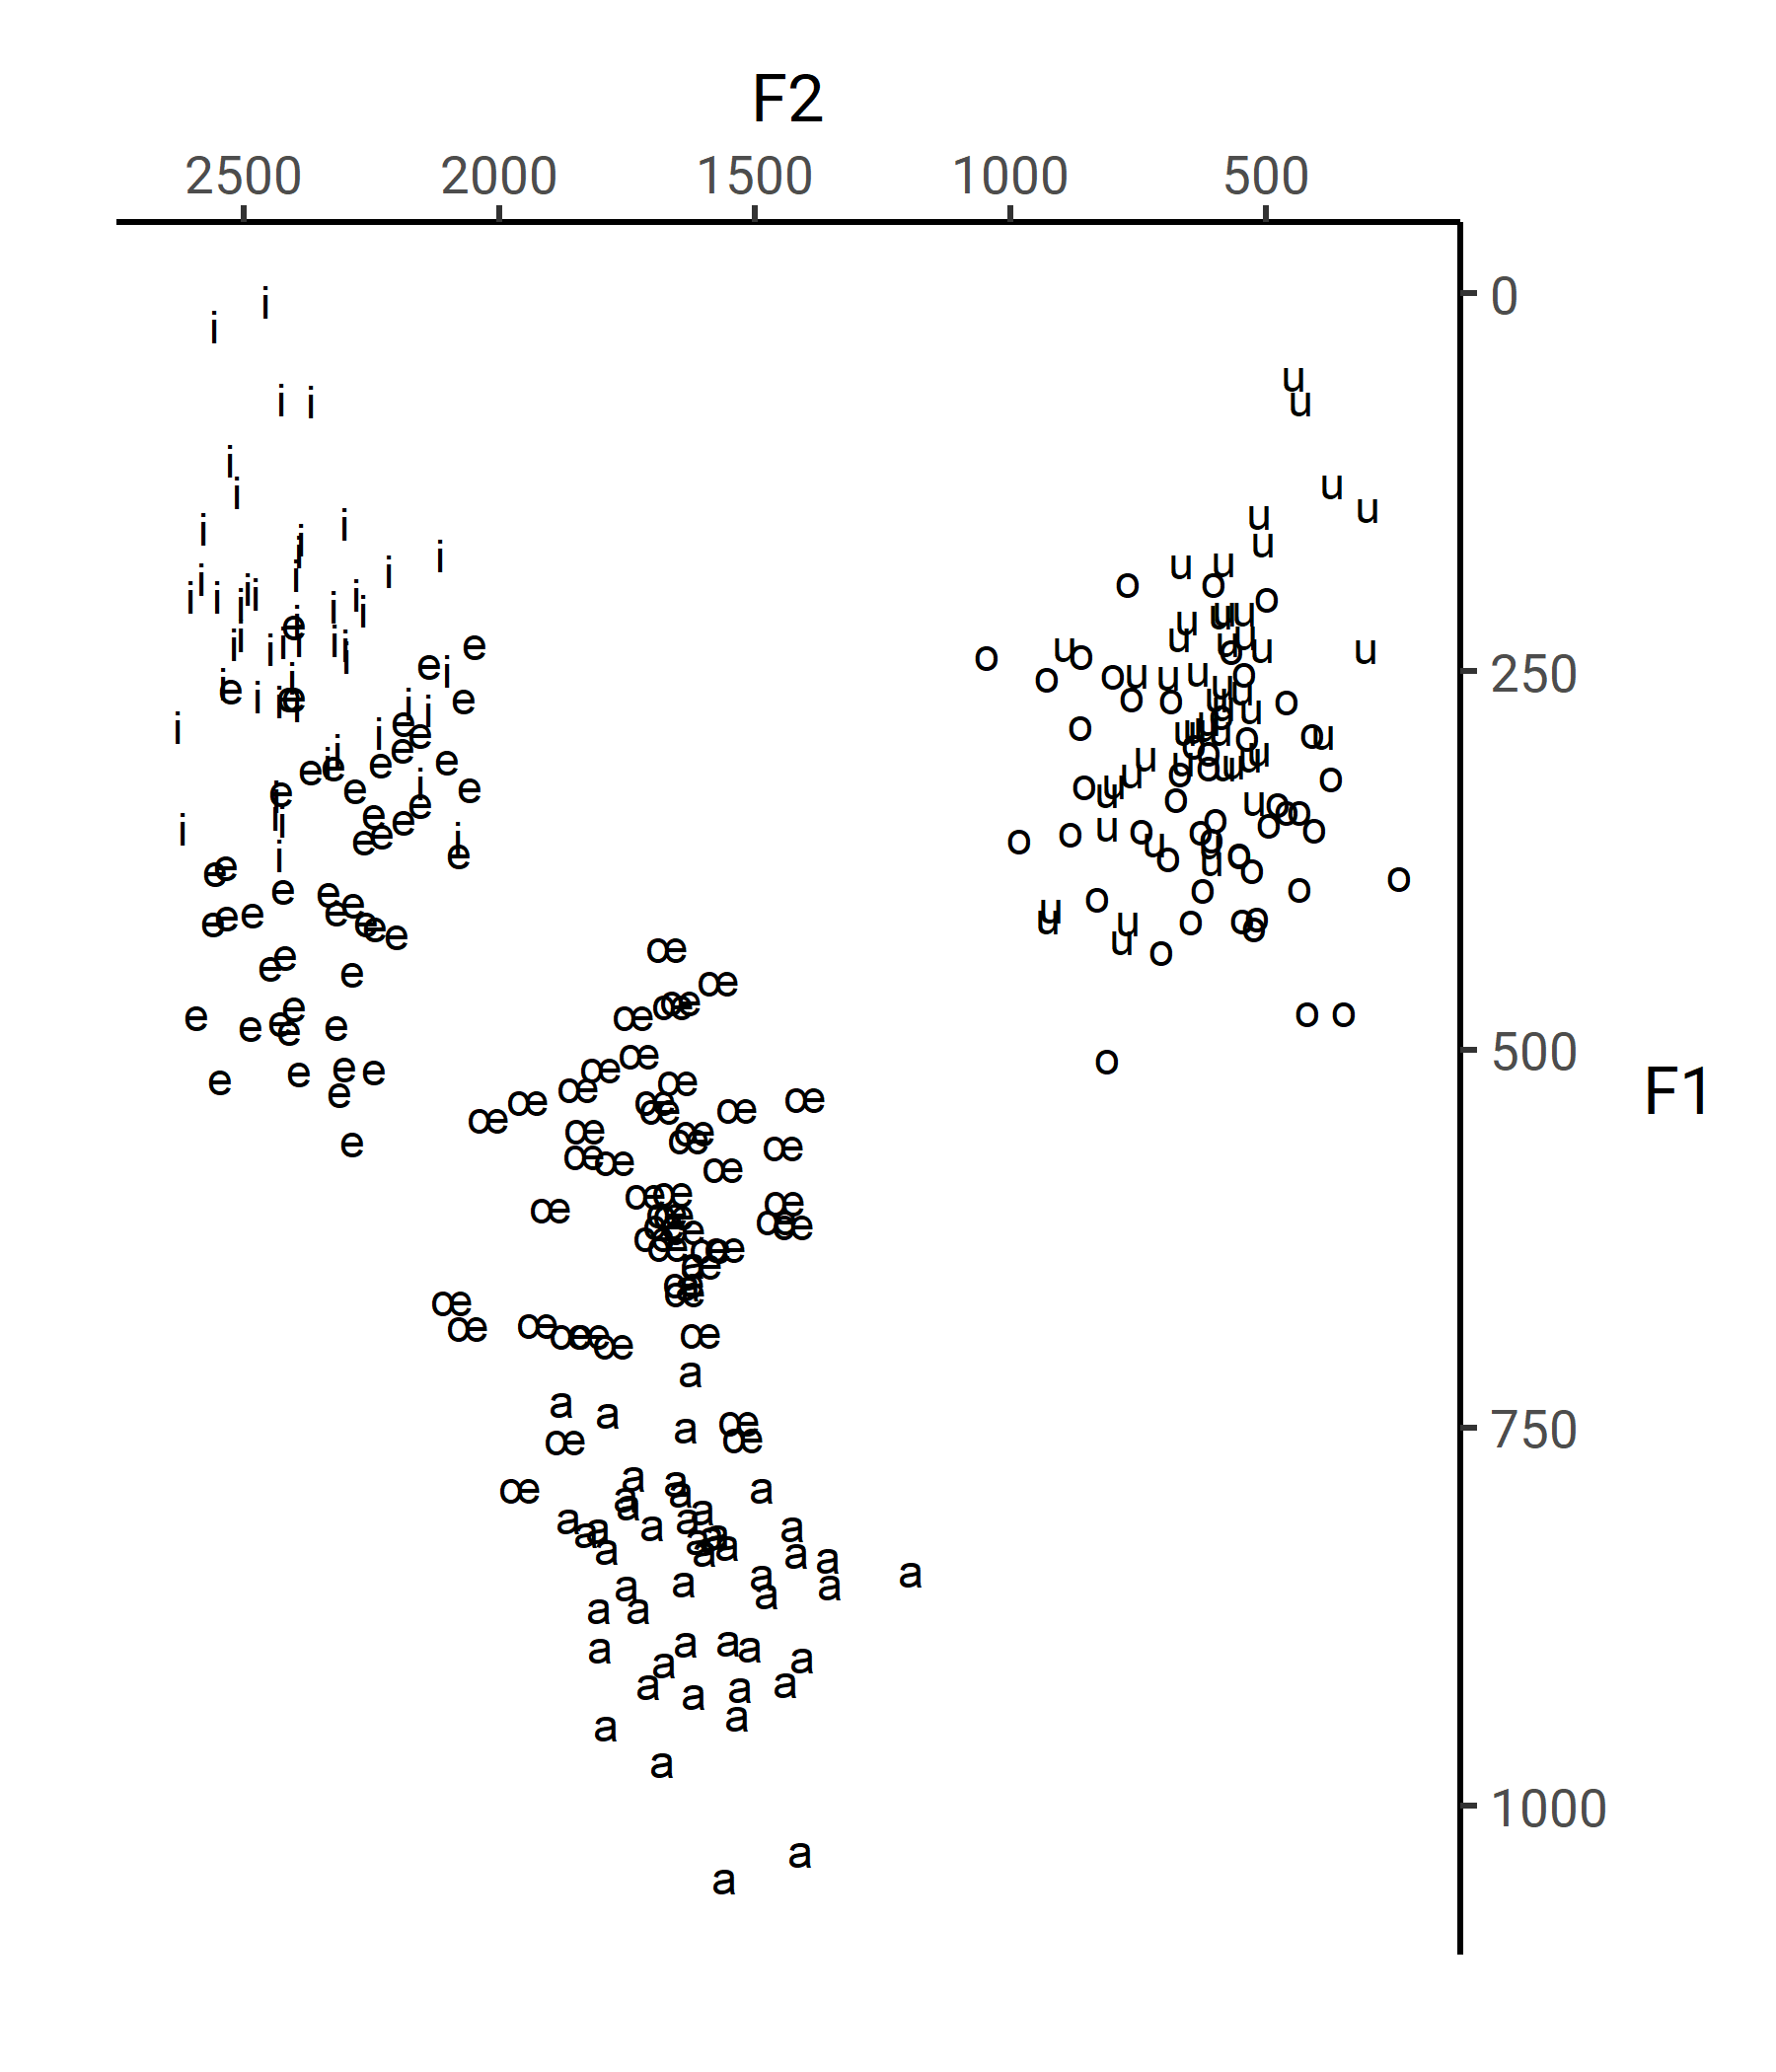<!-- --> ] --- count: false .panel1-vowels1-auto[ ```r sim_vowel_data %>% ggplot(aes(x = F2, y = F1)) + geom_text(aes(label = Vowel)) + scale_x_reverse( position = "top", breaks = pretty_breaks(5) ) + scale_y_reverse(position = "right") + theme( plot.margin = margin(.5,.5, 1, 1, unit = "cm"), axis.title.x.top = element_text(margin = margin(b = .2, unit = "cm")), axis.title.y.right = element_text( angle = 0, vjust = 0.5, margin = margin(l = .3, unit = "cm") ) ) + * stat_ellipse(aes(group = Vowel)) ``` ] .panel2-vowels1-auto[ 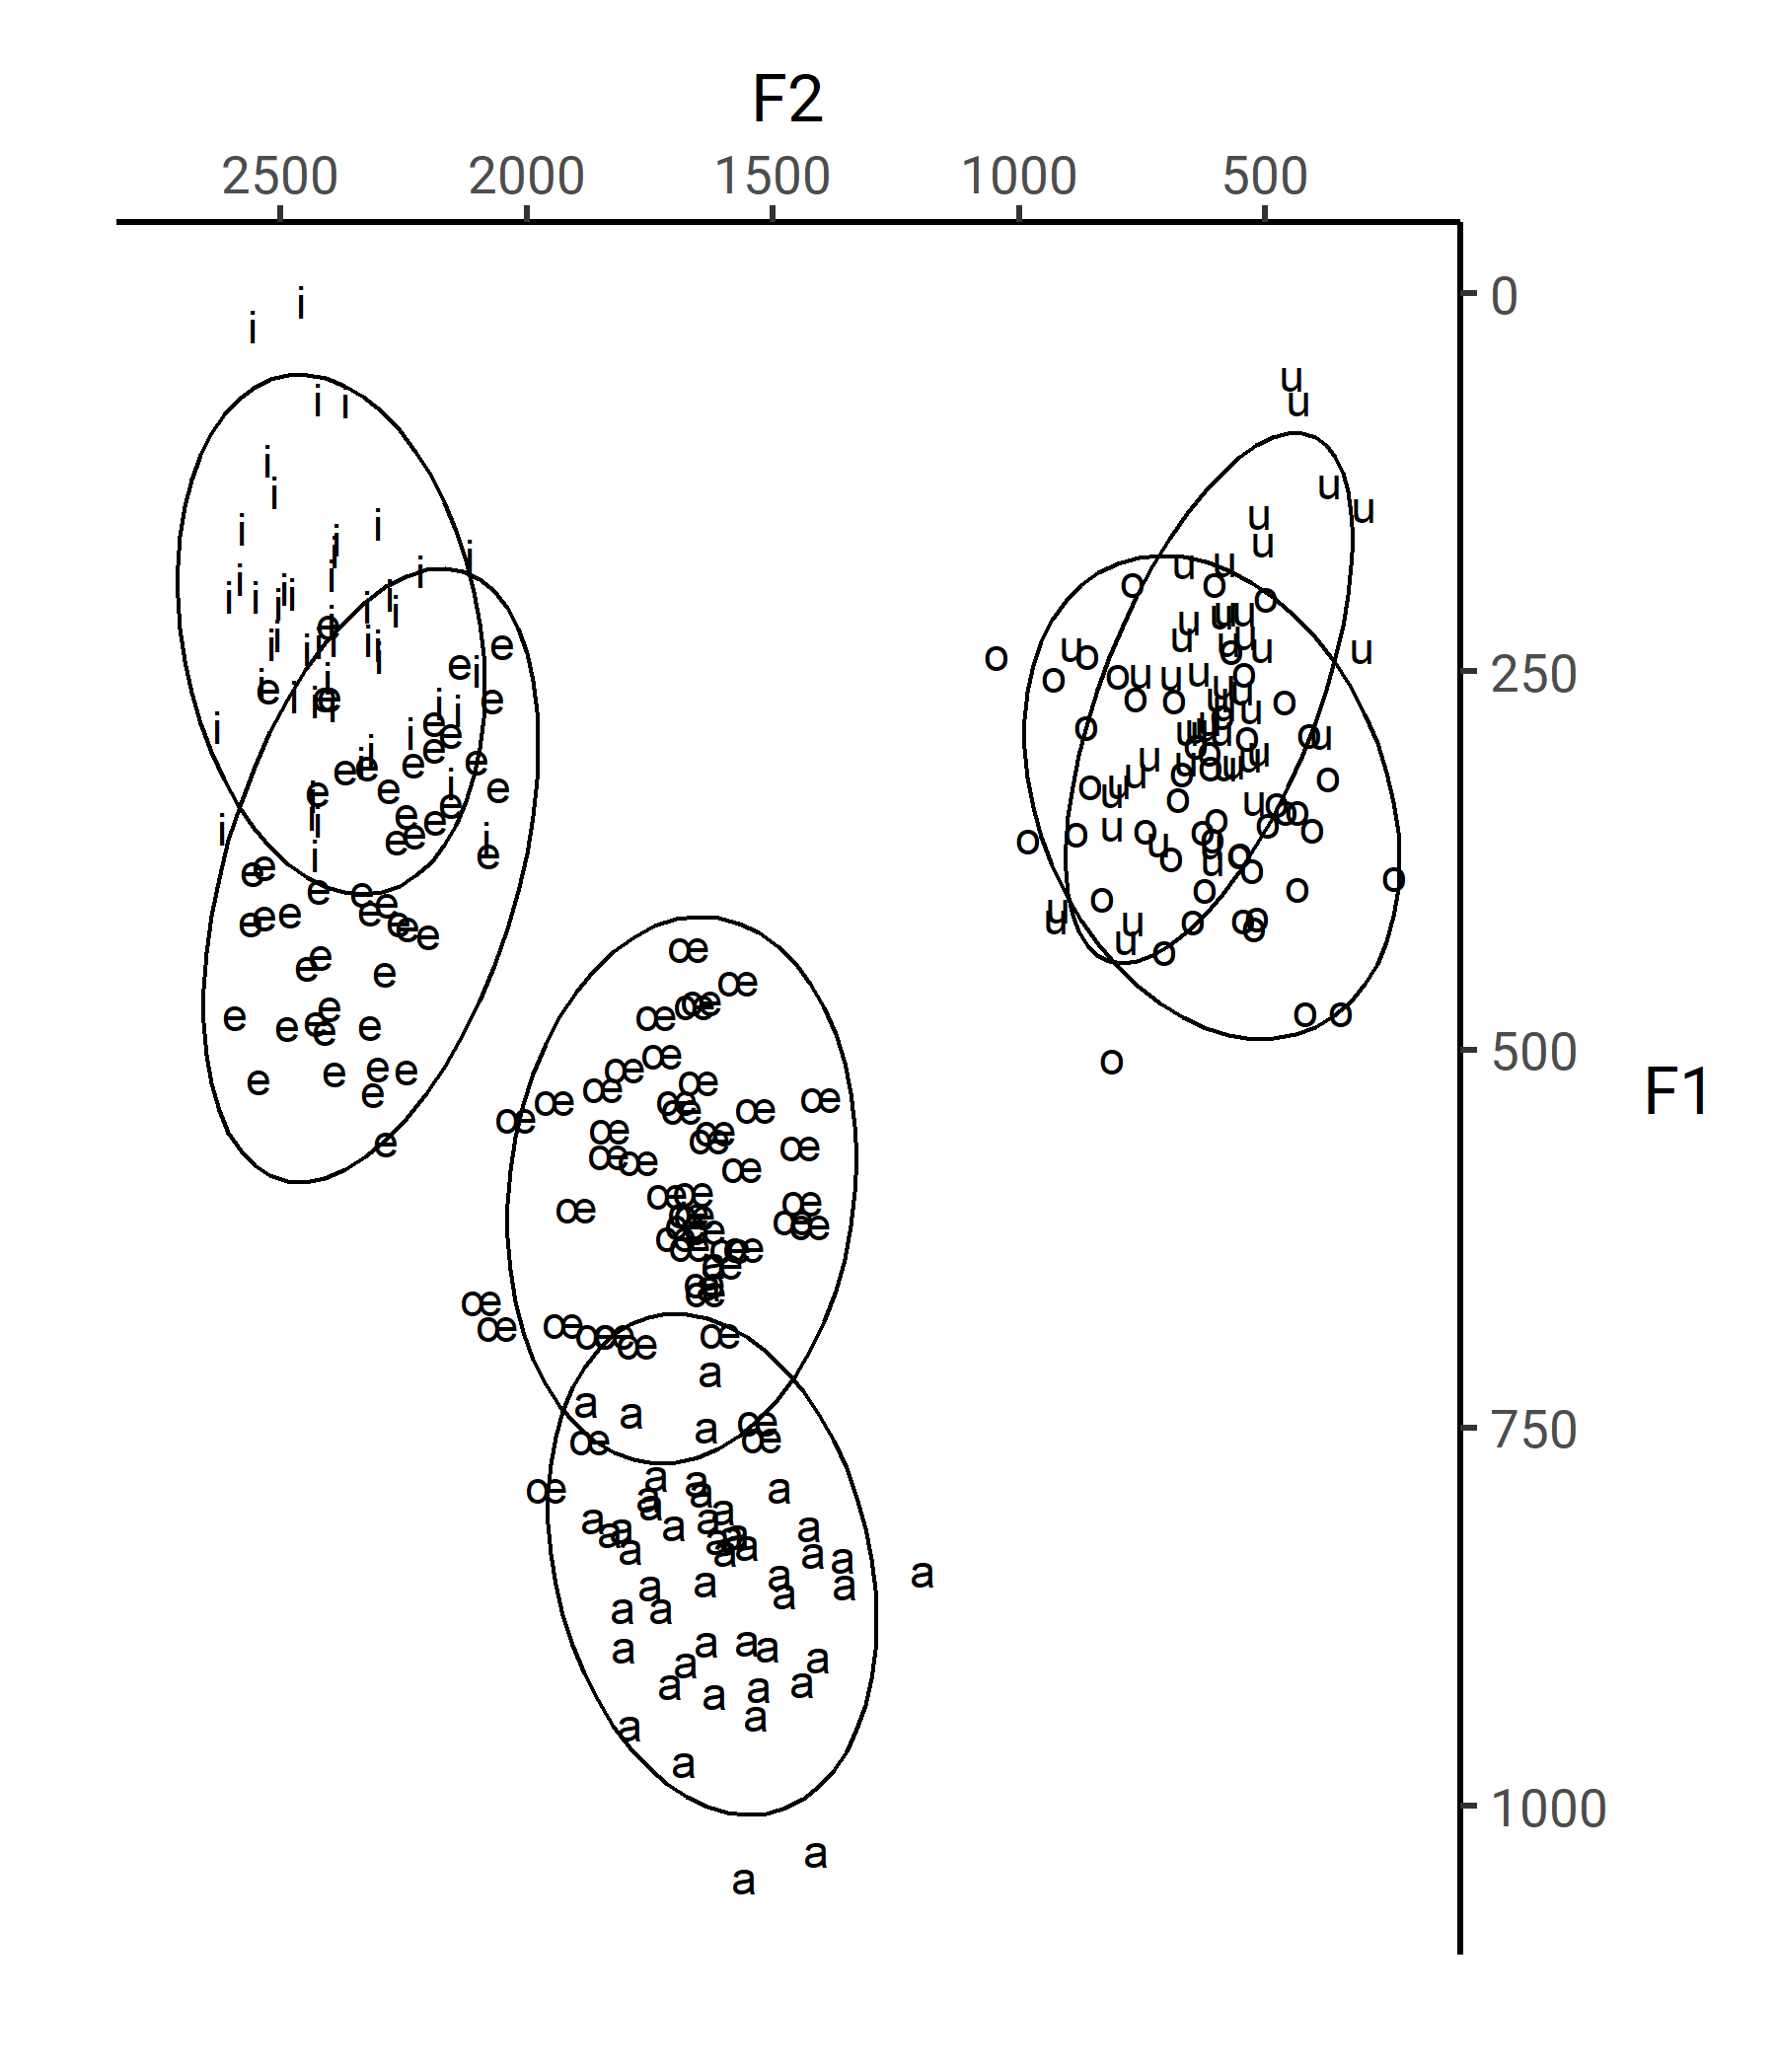<!-- --> ] <style> .panel1-vowels1-auto { color: black; width: 39.2%; hight: 32%; float: left; padding-left: 1%; font-size: 80% } .panel2-vowels1-auto { color: black; width: 58.8%; hight: 32%; float: left; padding-left: 1%; font-size: 80% } .panel3-vowels1-auto { color: black; width: NA%; hight: 33%; float: left; padding-left: 1%; font-size: 80% } </style> --- class: inverse, center, middle # 2. Vowel Space Plot --- count: false .panel1-vowels2-auto[ ```r *sim_vowel_data_all ``` ] .panel2-vowels2-auto[ ``` # A tibble: 800 x 3 Vowel F1 F2 <chr> <dbl> <dbl> 1 i 371. 2431. 2 i 332. 2435. 3 i 286. 2630. 4 i 110. 2527. 5 i 302. 2315. 6 i 199. 2279. 7 i 152. 2303. 8 i 173. 2116. 9 i 258. 2540. 10 i 200. 2604. # ... with 790 more rows ``` ] --- count: false .panel1-vowels2-auto[ ```r sim_vowel_data_all %>% * group_by(Vowel) ``` ] .panel2-vowels2-auto[ ``` # A tibble: 800 x 3 # Groups: Vowel [16] Vowel F1 F2 <chr> <dbl> <dbl> 1 i 371. 2431. 2 i 332. 2435. 3 i 286. 2630. 4 i 110. 2527. 5 i 302. 2315. 6 i 199. 2279. 7 i 152. 2303. 8 i 173. 2116. 9 i 258. 2540. 10 i 200. 2604. # ... with 790 more rows ``` ] --- count: false .panel1-vowels2-auto[ ```r sim_vowel_data_all %>% group_by(Vowel) %>% * summarize(across(c(F1, F2), mean), .groups = 'drop') ``` ] .panel2-vowels2-auto[ ``` # A tibble: 16 x 3 Vowel F1 F2 <chr> <dbl> <dbl> 1 <U+0251> 740. 912. 2 <U+0252> 699. 762. 3 <U+0254> 498. 748. 4 <U+025B> 606. 1905. 5 <U+0264> 466. 1300. 6 <U+026F> 305. 1400. 7 <U+0276> 852. 1532. 8 <U+028C> 603. 1165. 9 a 842. 1617. 10 e 383. 2321. 11 i 224. 2394. 12 o 332. 620. 13 ø 373. 1924. 14 œ 597. 1699. 15 u 266. 614. 16 y 235. 2099. ``` ] --- count: false .panel1-vowels2-auto[ ```r sim_vowel_data_all %>% group_by(Vowel) %>% summarize(across(c(F1, F2), mean), .groups = 'drop') %>% * ggplot(aes(x = F2, y = F1)) ``` ] .panel2-vowels2-auto[ <!-- --> ] --- count: false .panel1-vowels2-auto[ ```r sim_vowel_data_all %>% group_by(Vowel) %>% summarize(across(c(F1, F2), mean), .groups = 'drop') %>% ggplot(aes(x = F2, y = F1)) + * geom_text(aes(label = Vowel), size = 6, family = "Charis SIL") ``` ] .panel2-vowels2-auto[ 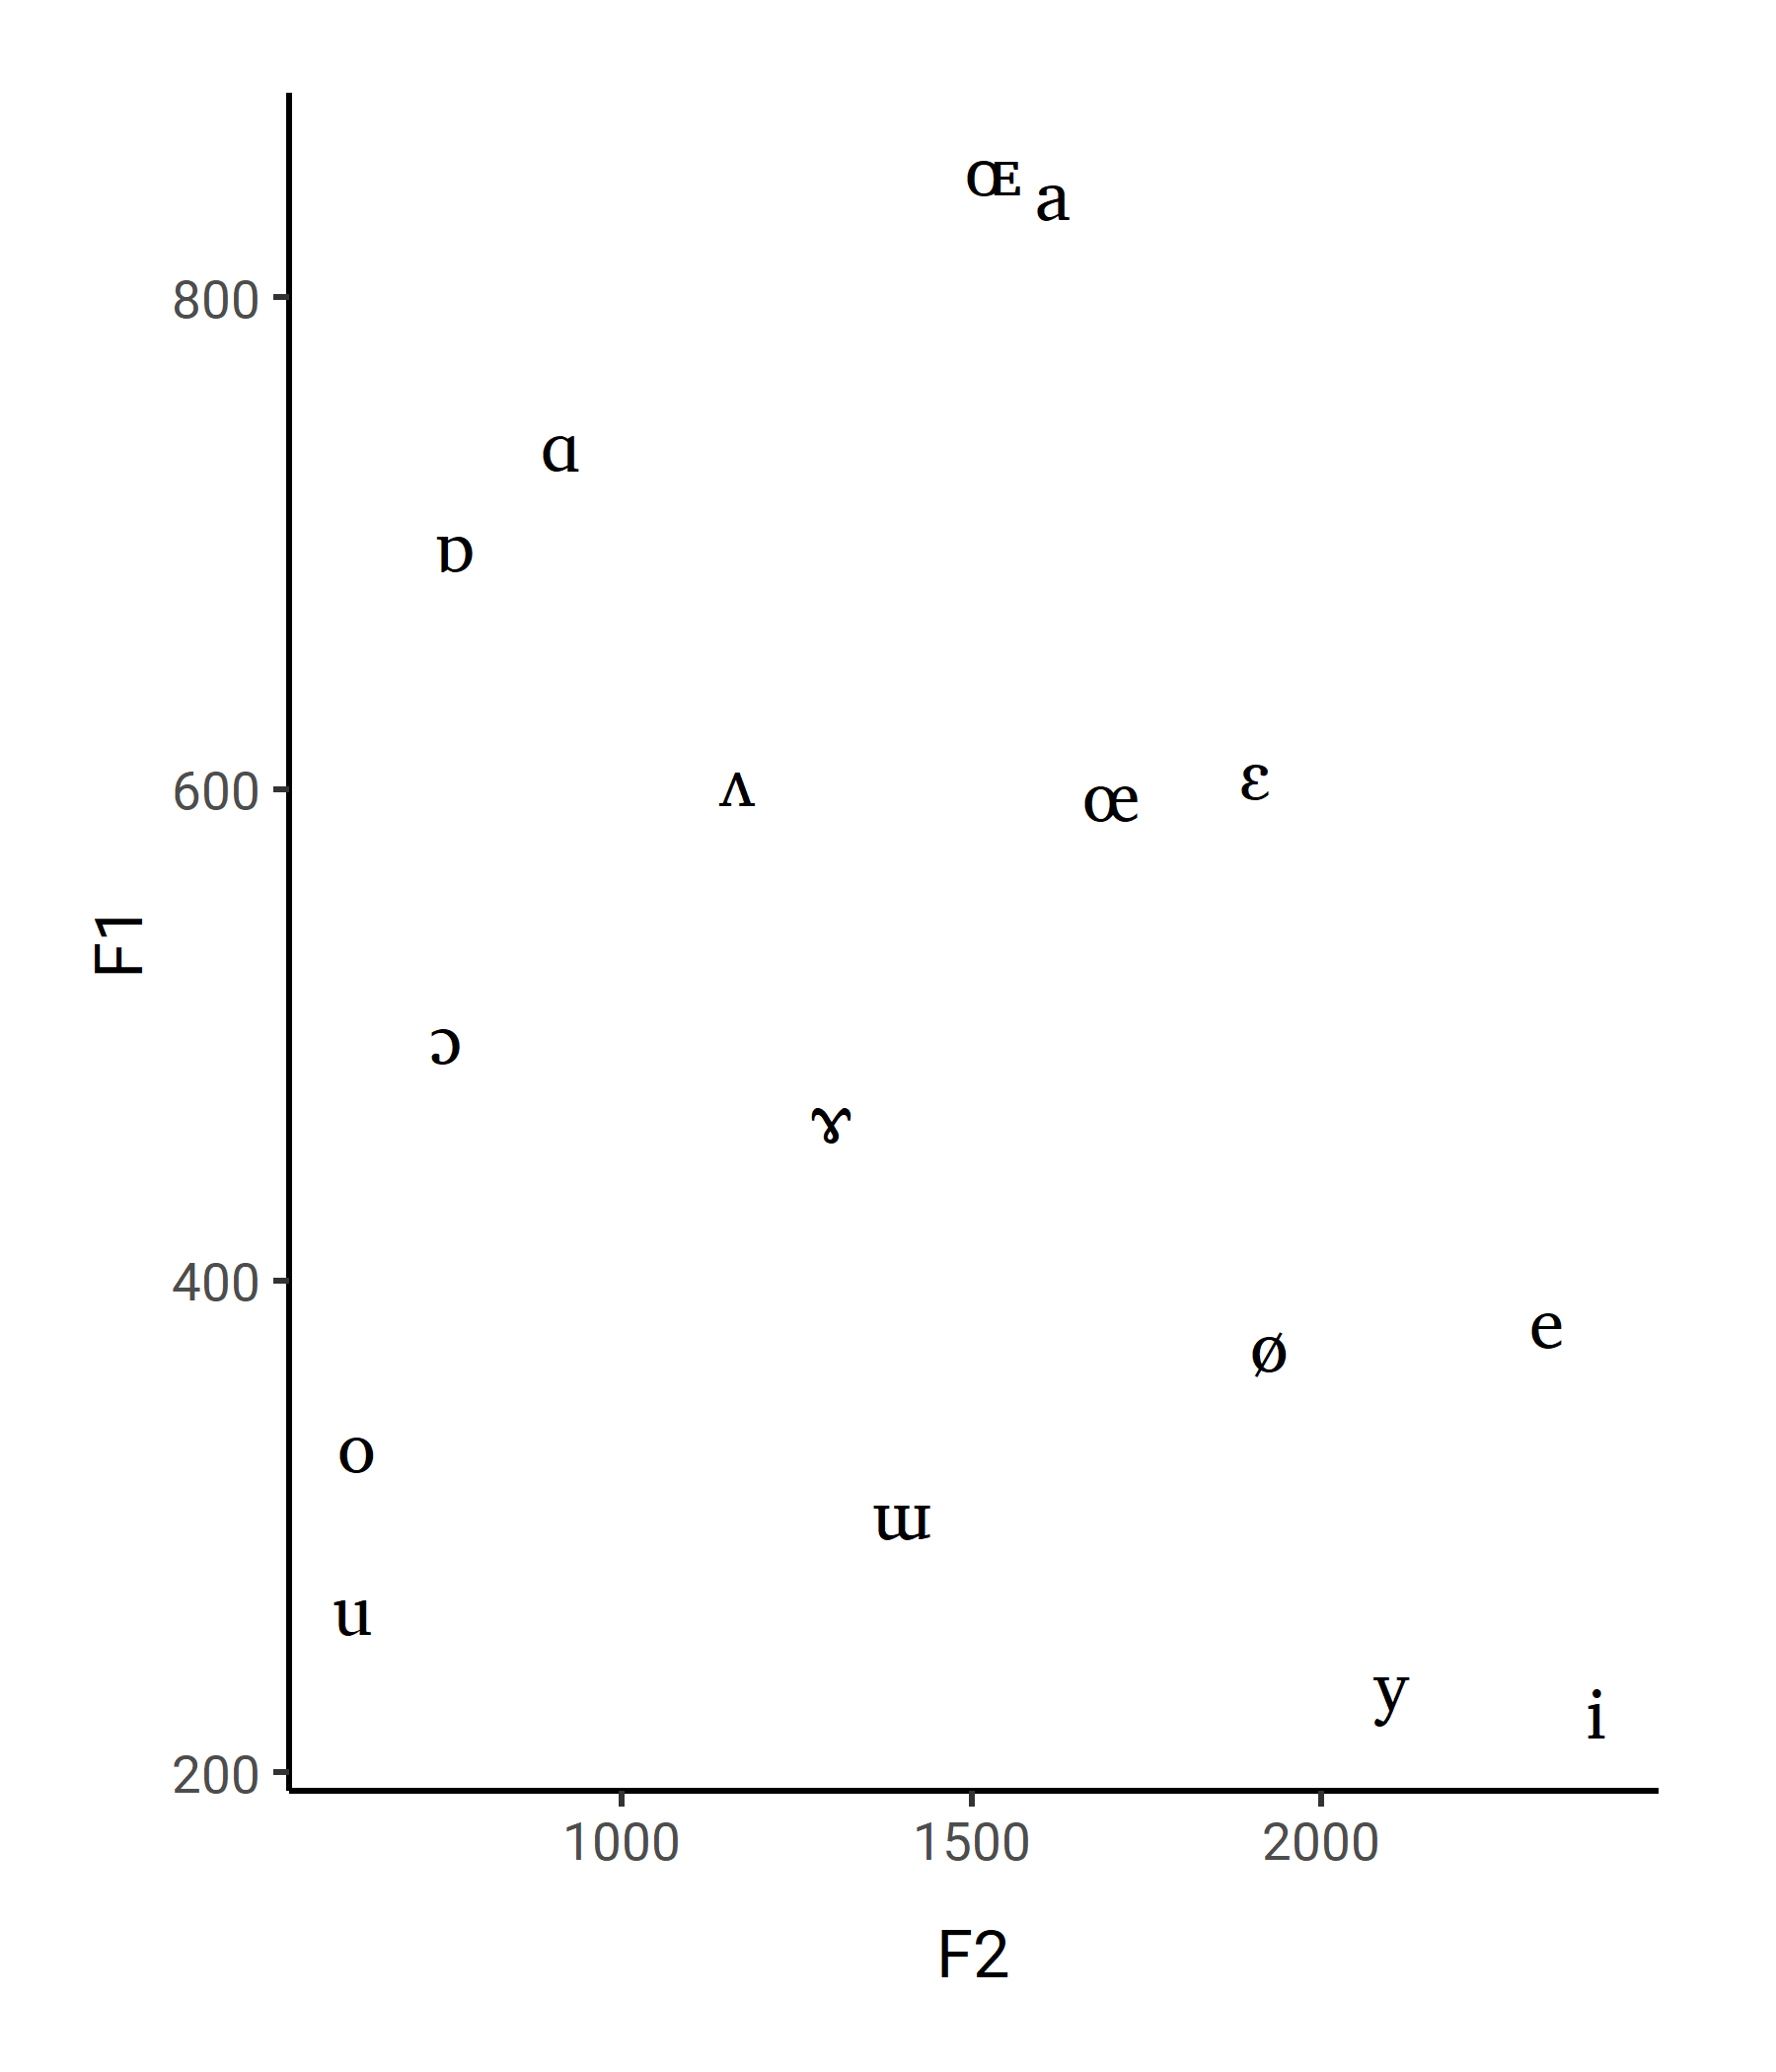<!-- --> ] --- count: false .panel1-vowels2-auto[ ```r sim_vowel_data_all %>% group_by(Vowel) %>% summarize(across(c(F1, F2), mean), .groups = 'drop') %>% ggplot(aes(x = F2, y = F1)) + geom_text(aes(label = Vowel), size = 6, family = "Charis SIL") + * scale_x_reverse( * position = "top", * breaks = pretty_breaks(5), * expand = expansion(.1) * ) ``` ] .panel2-vowels2-auto[ <!-- --> ] --- count: false .panel1-vowels2-auto[ ```r sim_vowel_data_all %>% group_by(Vowel) %>% summarize(across(c(F1, F2), mean), .groups = 'drop') %>% ggplot(aes(x = F2, y = F1)) + geom_text(aes(label = Vowel), size = 6, family = "Charis SIL") + scale_x_reverse( position = "top", breaks = pretty_breaks(5), expand = expansion(.1) ) + * scale_y_reverse( * position = "right", * expand = expansion(.1) * ) ``` ] .panel2-vowels2-auto[ <!-- --> ] --- count: false .panel1-vowels2-auto[ ```r sim_vowel_data_all %>% group_by(Vowel) %>% summarize(across(c(F1, F2), mean), .groups = 'drop') %>% ggplot(aes(x = F2, y = F1)) + geom_text(aes(label = Vowel), size = 6, family = "Charis SIL") + scale_x_reverse( position = "top", breaks = pretty_breaks(5), expand = expansion(.1) ) + scale_y_reverse( position = "right", expand = expansion(.1) ) + * theme( * plot.margin = margin(.5,.5, 1, 1, unit = "cm"), * axis.title.x.top = element_text(margin = margin(b = .2, unit = "cm")), * axis.title.y.right = element_text( * angle = 0, vjust = 0.5, margin = margin(l = .3, unit = "cm") * ) * ) ``` ] .panel2-vowels2-auto[ <!-- --> ] --- count: false .panel1-vowels2-auto[ ```r sim_vowel_data_all %>% group_by(Vowel) %>% summarize(across(c(F1, F2), mean), .groups = 'drop') %>% ggplot(aes(x = F2, y = F1)) + geom_text(aes(label = Vowel), size = 6, family = "Charis SIL") + scale_x_reverse( position = "top", breaks = pretty_breaks(5), expand = expansion(.1) ) + scale_y_reverse( position = "right", expand = expansion(.1) ) + theme( plot.margin = margin(.5,.5, 1, 1, unit = "cm"), axis.title.x.top = element_text(margin = margin(b = .2, unit = "cm")), axis.title.y.right = element_text( angle = 0, vjust = 0.5, margin = margin(l = .3, unit = "cm") ) ) + * stat_chull( * fill = NA, * color = "black", * linetype = 2 * ) ``` ] .panel2-vowels2-auto[ <!-- --> ] <style> .panel1-vowels2-auto { color: black; width: 39.2%; hight: 32%; float: left; padding-left: 1%; font-size: 80% } .panel2-vowels2-auto { color: black; width: 58.8%; hight: 32%; float: left; padding-left: 1%; font-size: 80% } .panel3-vowels2-auto { color: black; width: NA%; hight: 33%; float: left; padding-left: 1%; font-size: 80% } </style> --- class: inverse, center, middle # 3. Bar Plot of Proportions --- count: false .panel1-accuracy_bar-auto[ ```r *read_csv("https://raw.githubusercontent.com/yjunechoe/Semantic-Persistence/master/processed.csv") ``` ] .panel2-accuracy_bar-auto[ ``` # A tibble: 4,516 x 10 Value Item Cond Group Subject Time Answer Accuracy Type logRT <chr> <chr> <chr> <chr> <chr> <dbl> <chr> <dbl> <chr> <dbl> 1 Yes Awaken~ Subje~ B 5cfa77e907f7dd~ 917 No 0 Criti~ 6.82 2 No Awaken~ Subje~ B 5c1d21196036e4~ 2624 No 1 Criti~ 7.87 3 No Awaken~ Subje~ B 5d730aab6b4b16~ 2809 No 1 Criti~ 7.94 4 No Awaken~ Subje~ B 5ddef0fae454cd~ 1587 No 1 Criti~ 7.37 5 No Awaken~ Subje~ B 5e7a8e8b11bf56~ 1697 No 1 Criti~ 7.44 6 No Awaken~ Verb A 5d4613a2da9cb6~ 1484 No 1 Criti~ 7.30 7 No Awaken~ Verb A 579e1e2b275be6~ 1556 No 1 Criti~ 7.35 8 No Awaken~ Verb A 5dfe69ed11d879~ 1699 No 1 Criti~ 7.44 9 No Awaken~ Verb A 5b9442cecd3808~ 2159 No 1 Criti~ 7.68 10 No Awaken~ Verb A 5e7f3328849917~ 1132 No 1 Criti~ 7.03 # ... with 4,506 more rows ``` ] --- count: false .panel1-accuracy_bar-auto[ ```r read_csv("https://raw.githubusercontent.com/yjunechoe/Semantic-Persistence/master/processed.csv") %>% * filter(Type == "Critical") ``` ] .panel2-accuracy_bar-auto[ ``` # A tibble: 1,466 x 10 Value Item Cond Group Subject Time Answer Accuracy Type logRT <chr> <chr> <chr> <chr> <chr> <dbl> <chr> <dbl> <chr> <dbl> 1 Yes Awaken~ Subje~ B 5cfa77e907f7dd~ 917 No 0 Criti~ 6.82 2 No Awaken~ Subje~ B 5c1d21196036e4~ 2624 No 1 Criti~ 7.87 3 No Awaken~ Subje~ B 5d730aab6b4b16~ 2809 No 1 Criti~ 7.94 4 No Awaken~ Subje~ B 5ddef0fae454cd~ 1587 No 1 Criti~ 7.37 5 No Awaken~ Subje~ B 5e7a8e8b11bf56~ 1697 No 1 Criti~ 7.44 6 No Awaken~ Verb A 5d4613a2da9cb6~ 1484 No 1 Criti~ 7.30 7 No Awaken~ Verb A 579e1e2b275be6~ 1556 No 1 Criti~ 7.35 8 No Awaken~ Verb A 5dfe69ed11d879~ 1699 No 1 Criti~ 7.44 9 No Awaken~ Verb A 5b9442cecd3808~ 2159 No 1 Criti~ 7.68 10 No Awaken~ Verb A 5e7f3328849917~ 1132 No 1 Criti~ 7.03 # ... with 1,456 more rows ``` ] --- count: false .panel1-accuracy_bar-auto[ ```r read_csv("https://raw.githubusercontent.com/yjunechoe/Semantic-Persistence/master/processed.csv") %>% filter(Type == "Critical") %>% * group_by(Cond, Group) ``` ] .panel2-accuracy_bar-auto[ ``` # A tibble: 1,466 x 10 # Groups: Cond, Group [4] Value Item Cond Group Subject Time Answer Accuracy Type logRT <chr> <chr> <chr> <chr> <chr> <dbl> <chr> <dbl> <chr> <dbl> 1 Yes Awaken~ Subje~ B 5cfa77e907f7dd~ 917 No 0 Criti~ 6.82 2 No Awaken~ Subje~ B 5c1d21196036e4~ 2624 No 1 Criti~ 7.87 3 No Awaken~ Subje~ B 5d730aab6b4b16~ 2809 No 1 Criti~ 7.94 4 No Awaken~ Subje~ B 5ddef0fae454cd~ 1587 No 1 Criti~ 7.37 5 No Awaken~ Subje~ B 5e7a8e8b11bf56~ 1697 No 1 Criti~ 7.44 6 No Awaken~ Verb A 5d4613a2da9cb6~ 1484 No 1 Criti~ 7.30 7 No Awaken~ Verb A 579e1e2b275be6~ 1556 No 1 Criti~ 7.35 8 No Awaken~ Verb A 5dfe69ed11d879~ 1699 No 1 Criti~ 7.44 9 No Awaken~ Verb A 5b9442cecd3808~ 2159 No 1 Criti~ 7.68 10 No Awaken~ Verb A 5e7f3328849917~ 1132 No 1 Criti~ 7.03 # ... with 1,456 more rows ``` ] --- count: false .panel1-accuracy_bar-auto[ ```r read_csv("https://raw.githubusercontent.com/yjunechoe/Semantic-Persistence/master/processed.csv") %>% filter(Type == "Critical") %>% group_by(Cond, Group) %>% * summarize(Accuracy = mean(Accuracy, na.rm = TRUE), .groups = 'drop') ``` ] .panel2-accuracy_bar-auto[ ``` # A tibble: 4 x 3 Cond Group Accuracy <chr> <chr> <dbl> 1 Subject A 0.875 2 Subject B 0.780 3 Verb A 0.846 4 Verb B 0.710 ``` ] --- count: false .panel1-accuracy_bar-auto[ ```r read_csv("https://raw.githubusercontent.com/yjunechoe/Semantic-Persistence/master/processed.csv") %>% filter(Type == "Critical") %>% group_by(Cond, Group) %>% summarize(Accuracy = mean(Accuracy, na.rm = TRUE), .groups = 'drop') %>% * ggplot(aes(x = Cond, y = Accuracy, fill = Group)) ``` ] .panel2-accuracy_bar-auto[ <!-- --> ] --- count: false .panel1-accuracy_bar-auto[ ```r read_csv("https://raw.githubusercontent.com/yjunechoe/Semantic-Persistence/master/processed.csv") %>% filter(Type == "Critical") %>% group_by(Cond, Group) %>% summarize(Accuracy = mean(Accuracy, na.rm = TRUE), .groups = 'drop') %>% ggplot(aes(x = Cond, y = Accuracy, fill = Group)) + * geom_col(position = "dodge", color = "white", width = .7, size = 2) ``` ] .panel2-accuracy_bar-auto[ <!-- --> ] --- count: false .panel1-accuracy_bar-auto[ ```r read_csv("https://raw.githubusercontent.com/yjunechoe/Semantic-Persistence/master/processed.csv") %>% filter(Type == "Critical") %>% group_by(Cond, Group) %>% summarize(Accuracy = mean(Accuracy, na.rm = TRUE), .groups = 'drop') %>% ggplot(aes(x = Cond, y = Accuracy, fill = Group)) + geom_col(position = "dodge", color = "white", width = .7, size = 2) + * scale_fill_manual(values = c("grey30", "grey70")) ``` ] .panel2-accuracy_bar-auto[ <!-- --> ] --- count: false .panel1-accuracy_bar-auto[ ```r read_csv("https://raw.githubusercontent.com/yjunechoe/Semantic-Persistence/master/processed.csv") %>% filter(Type == "Critical") %>% group_by(Cond, Group) %>% summarize(Accuracy = mean(Accuracy, na.rm = TRUE), .groups = 'drop') %>% ggplot(aes(x = Cond, y = Accuracy, fill = Group)) + geom_col(position = "dodge", color = "white", width = .7, size = 2) + scale_fill_manual(values = c("grey30", "grey70")) + * labs( * title = "Accuracy on Comprehension Task", * x = "Pitch Accent Condition", y = NULL, * fill = "Experiment Group" * ) ``` ] .panel2-accuracy_bar-auto[ <!-- --> ] --- count: false .panel1-accuracy_bar-auto[ ```r read_csv("https://raw.githubusercontent.com/yjunechoe/Semantic-Persistence/master/processed.csv") %>% filter(Type == "Critical") %>% group_by(Cond, Group) %>% summarize(Accuracy = mean(Accuracy, na.rm = TRUE), .groups = 'drop') %>% ggplot(aes(x = Cond, y = Accuracy, fill = Group)) + geom_col(position = "dodge", color = "white", width = .7, size = 2) + scale_fill_manual(values = c("grey30", "grey70")) + labs( title = "Accuracy on Comprehension Task", x = "Pitch Accent Condition", y = NULL, fill = "Experiment Group" ) + * guides(fill = guide_legend(direction = "horizontal", title.position = "top")) ``` ] .panel2-accuracy_bar-auto[ <!-- --> ] --- count: false .panel1-accuracy_bar-auto[ ```r read_csv("https://raw.githubusercontent.com/yjunechoe/Semantic-Persistence/master/processed.csv") %>% filter(Type == "Critical") %>% group_by(Cond, Group) %>% summarize(Accuracy = mean(Accuracy, na.rm = TRUE), .groups = 'drop') %>% ggplot(aes(x = Cond, y = Accuracy, fill = Group)) + geom_col(position = "dodge", color = "white", width = .7, size = 2) + scale_fill_manual(values = c("grey30", "grey70")) + labs( title = "Accuracy on Comprehension Task", x = "Pitch Accent Condition", y = NULL, fill = "Experiment Group" ) + guides(fill = guide_legend(direction = "horizontal", title.position = "top")) + * coord_capped_cart( * ylim = c(0.5, 1), * left = "top" * ) ``` ] .panel2-accuracy_bar-auto[ <!-- --> ] --- count: false .panel1-accuracy_bar-auto[ ```r read_csv("https://raw.githubusercontent.com/yjunechoe/Semantic-Persistence/master/processed.csv") %>% filter(Type == "Critical") %>% group_by(Cond, Group) %>% summarize(Accuracy = mean(Accuracy, na.rm = TRUE), .groups = 'drop') %>% ggplot(aes(x = Cond, y = Accuracy, fill = Group)) + geom_col(position = "dodge", color = "white", width = .7, size = 2) + scale_fill_manual(values = c("grey30", "grey70")) + labs( title = "Accuracy on Comprehension Task", x = "Pitch Accent Condition", y = NULL, fill = "Experiment Group" ) + guides(fill = guide_legend(direction = "horizontal", title.position = "top")) + coord_capped_cart( ylim = c(0.5, 1), left = "top" ) + * theme( * axis.ticks.x = element_blank(), * axis.text.x = element_text(color = "black", margin = margin(t = .2, unit = "cm")), * legend.position = c(.3, .93), * plot.title = element_text(margin = margin(b = 1, unit = "cm")) * ) ``` ] .panel2-accuracy_bar-auto[ <!-- --> ] --- count: false .panel1-accuracy_bar-auto[ ```r read_csv("https://raw.githubusercontent.com/yjunechoe/Semantic-Persistence/master/processed.csv") %>% filter(Type == "Critical") %>% group_by(Cond, Group) %>% summarize(Accuracy = mean(Accuracy, na.rm = TRUE), .groups = 'drop') %>% ggplot(aes(x = Cond, y = Accuracy, fill = Group)) + geom_col(position = "dodge", color = "white", width = .7, size = 2) + scale_fill_manual(values = c("grey30", "grey70")) + labs( title = "Accuracy on Comprehension Task", x = "Pitch Accent Condition", y = NULL, fill = "Experiment Group" ) + guides(fill = guide_legend(direction = "horizontal", title.position = "top")) + coord_capped_cart( ylim = c(0.5, 1), left = "top" ) + theme( axis.ticks.x = element_blank(), axis.text.x = element_text(color = "black", margin = margin(t = .2, unit = "cm")), legend.position = c(.3, .93), plot.title = element_text(margin = margin(b = 1, unit = "cm")) ) + * scale_y_continuous( * expand = expansion(0, 0), * labels = percent_format(accuracy = 1) * ) ``` ] .panel2-accuracy_bar-auto[ <!-- --> ] <style> .panel1-accuracy_bar-auto { color: black; width: 39.2%; hight: 32%; float: left; padding-left: 1%; font-size: 80% } .panel2-accuracy_bar-auto { color: black; width: 58.8%; hight: 32%; float: left; padding-left: 1%; font-size: 80% } .panel3-accuracy_bar-auto { color: black; width: NA%; hight: 33%; float: left; padding-left: 1%; font-size: 80% } </style> --- class: inverse, center, middle # 4. Multiple Categorical Levels --- class: center, middle <img src="https://yjunechoe.github.io/posts/2020-09-20-plot-makeover-1/plot.png" height="500px" /> Source: [Husband & Patson (2020)](https://amlap2020.github.io/a/272.pdf) --- .pull-left[ ```r df <- crossing(level_1 = fct_inorder(c("Within", "Between")), level_2 = fct_inorder(c("Some", "Number", "Or")), level_3 = factor(c("Strong", "Weak"))) df$barheight <- c(.63, .35, .72, .55, .61, .15, .60, .55, .52, .63, .17, .16) df %>% ggplot(aes(level_3, barheight)) + geom_col( aes(fill = level_3), show.legend = FALSE ) + geom_errorbar( aes(ymin = barheight - .05, ymax = barheight + .05), width = .1) + facet_grid(level_2 ~ level_1) + theme_bw() + scale_fill_manual(values = c('grey40', 'grey80')) + ylim(0, 1) + labs( y = "Proportion of Strong Responses", x = "Prime Type") + theme_bw() ``` ] .pull-right[ <img src="https://yjunechoe.github.io/posts/2020-09-20-plot-makeover-1/plot-makeover-1_files/figure-html5/unnamed-chunk-3-1.png" width="350px" /> ] --- class: center, middle <img src="https://yjunechoe.github.io/posts/2020-09-20-plot-makeover-1/plot-makeover-1_files/figure-html5/after_bar_plot-1.png" height="500px" /> ([Code](https://yjunechoe.github.io/posts/2020-09-20-plot-makeover-1/)) --- class: center, middle <img src="https://yjunechoe.github.io/posts/2020-09-20-plot-makeover-1/plot-makeover-1_files/figure-html5/after_pointplot-1.png" height="500px" /> ([Code](https://yjunechoe.github.io/posts/2020-09-20-plot-makeover-1/)) --- class: inverse, center, middle # 5. Animations: Vowel shift --- .pull-left[ ```r read_csv("https://raw.githubusercontent.com/bodowinter/canadian_vowel_shift_analysis/master/processed_data/production_processed.csv") %>% group_by(Gender, Vowel, BirthDecade = 10 * BirthYear %/% 10) %>% summarize(across(F1:F2, mean), .groups = 'drop') %>% filter(Gender == "F") %>% ggplot(aes(F2, F1)) + geom_text(aes(1450, 615, label = as.character(BirthDecade)), color = "gray80", size = 48) + stat_chull(fill = NA, color = "black", linetype = 2) + geom_label(aes(label = Vowel), size = 6, family = "Charis SIL") + scale_x_reverse(position = "top") + scale_y_reverse(position = "right") + theme( plot.margin = margin(.5,.8, 1.2, 1, unit = "cm"), axis.title.x.top = element_text(margin = margin(b = .2, unit = "cm")), axis.title.y.right = element_text(angle = 0, vjust = 0.5, margin = margin(l = .3, unit = "cm")) ) + coord_cartesian(clip = 'off') + labs(title = "Canadian Vowel Shift", caption = "Source: Kettig & Winter (2017)") + transition_states(BirthDecade) + shadow_mark( alpha = .1, color = "grey", exclude_layer = c(1, 2) ) ``` ] .pull-right[ <br> <br> <img src="P_lab_ggplot2_files/canada_vowel_shift.gif" width="500px" /> ] --- class: inverse, center, middle # 5. Animations: Eye-tracking --- class: center, middle <div class="figure"> <img src="P_lab_ggplot2_files/eyetrack_original.png" alt="de Carvalho et al. (2017)" width="720" height="500px" /> <p class="caption">de Carvalho et al. (2017)</p> </div> --- class: center, middle <img src="https://yjunechoe.github.io/static/dataviz/eyetracking_anim.gif" height="500px" /> ([Code](https://gist.github.com/yjunechoe/b39e92889768b26faaec3e0103d4af10)) --- # Resources <span style = "font-variant: small-caps;">light</span> - [The Glamour of Graphics](https://rstudio.com/resources/rstudioconf-2020/the-glamour-of-graphics/) (20-min video) - [Gallery of plot tyes](https://www.data-to-viz.com/) - [What to consider when choosing colors for data viz](https://blog.datawrapper.de/colors/) - [Palettes (in R)](https://github.com/EmilHvitfeldt/r-color-palettes) <span style = "font-variant: small-caps;">heavy</span> - [Font Recommendations](https://practicaltypography.com/font-recommendations.html) (book chapter) - [Theme elements in ggplot2](https://ggplot2.tidyverse.org/reference/theme.html) (documentation) - [ggplot2 tutorial](https://www.youtube.com/watch?v=h29g21z0a68) (4-hour video, 2 parts) - [ggplot2 book](https://ggplot2-book.org/)